Bridging Loans London - Fast Finance for Property Investors
London moves fast. Lendlord funds bridging loans across Greater London from 0.75% pm , with up to 75% of purchase price and up to 90% of market valuation , completion in as little as 5 working days , and purchase plus refurbishment in one facility. Direct lender, no broker fees - built for auction lots, refurbs, HMO conversions and refinance exits.
Last Updated: June 23, 2026
- 0.75%
- From p/m
- 90%
- Max LTV
- 5 days
- To Fund
- £30k-£3M
- Loan Size

Bridging loans London investors use when speed beats a mortgage timeline: auction completions, chain breaks, refurbs and refinance exits across every borough. Lendlord is a direct lender - get a 90% ltv bridging loan from £30k to £3M at rates from 0.75% pm, with up to 75% of purchase price and up to 90% of market valuation.
Why London investors use bridging finance
London is the UK's most competitive property market. Average prices sit at £542,000 (March 2026, UK HPI), but borough-level spreads run from under £362k to over £672k. That diversity creates opportunity - and it means your exit strategy must match the asset, not just the headline rate.
Bridging solves three London-specific problems:
- Speed - auction deadlines, chain breaks and off-market deals need certainty in days, not the 6-8 weeks a mortgage takes
- Leverage - up to 75% of purchase price, or up to 90% of market valuation, keeps more capital free across multiple boroughs
- Flexibility - fund unmortgageable stock, heavy refurbs and HMO conversions in one facility, then refinance or sell at the new value
"In London, the bridge is rarely the hard part. The hard part is picking a borough where your exit - sale or refinance - still works once bridging costs are in."
Claire - Senior Bridging Specialist, LendlordLondon property investment data (2026)
City-wide snapshot for UK property investors and landlords. Estimated gross yield = (average monthly rent × 12) ÷ average house price. House prices from ONS UK HPI (provisional March 2026); stock-average rent from ONS Private Rents (April 2026); bedroom means from ONS Private rental market in London, April 2025 to March 2026.
London Property Investment Data 2026
Prices, rents, estimated yields and bridging loan use cases for UK landlords
- £542k
- Avg house price
- £2,290/mo
- Avg private rent
- 5.1%
- Est. gross yield
- Exit planning
- Bridging angle
| Data point | London 2026 figure | Investor meaning | Bridging loan angle |
|---|---|---|---|
| Average house price | £542,000 (Mar 2026 ONS HPI) | Entry price, equity buffer, LTV screening | Size purchase bridge & refinance exit |
| Average private rent | £2,290/mo (Apr 2026 ONS) | Baseline rental income across all property types | Bridge-to-let & refinance modelling |
| Estimated gross yield | 5.1% | Rent-to-price strength - compressed vs UK regions | BTL refinance exit viability |
| Detached average price | £1,133k | Premium stock, lower headline yield | Resale or high-spec refurb exit |
| Terraced average price | £632k | Family stock - held value (+1.3% YoY) | Auction refurb & BTL exits |
| Flats/maisonettes average price | £420k | Large flat market - fell 5.5% YoY in 2026 | Flat bridges - check service charges & EWS1 |
| 1-bed average rent | £1,714/mo (ONS London mean) | Single-let / professional demand | City flat purchase bridges |
| 2-bed average rent | £2,098/mo (ONS London mean) | Couple, sharers & small family lets | Terraced & flat BTL exits |
| 3-bed average rent | £2,573/mo (ONS London mean) | Family rental core | Refurb-to-let bridges |
| 4-bed+ average rent | £3,656/mo (ONS London mean) | HMO & large family lets | Conversion & multi-let exits |
Investor takeaway: London spans £420k flats to £1.13m detached stock - terraced prices held up while flats fell 5.5% YoY in March 2026. Model bridging costs against your exit (BTL refinance, HMO conversion or resale) and verify borough-level rents before you commit.
Indicative figures for deal screening only, not net returns or lending decisions. Bedroom means are London-wide administrative averages (Apr 2025-Mar 2026). Verify with official ONS releases and postcode-level comparables before purchase.London market snapshot (2026)
Updated figures for Greater London, sourced from the UK House Price Index, March 2026 and Lendlord market analysis:
| Metric | London data | Investor takeaway |
|---|---|---|
| Average property price | £542,000 (Mar 2026) | Entry cost and likely loan size |
| 12-month price change | -2.1% YoY | London was the weakest English region; plan exits carefully |
| Flat / maisonette change | -5.5% YoY | Flats underperformed terraced stock |
| Terraced change | +1.3% YoY | Family terraces held value better |
| Approx. price per sq ft | ~£660 / sq ft | Refurb and conversion appraisal benchmark |
| London sales volume (12m) | ~68,600 transactions | Liquidity for sale exits |
| Average days to sell | ~41 days | Sale exit inside a 12-18 month bridge is realistic |
| Auction activity | 246 lots (sample sale, 75% sold) | Active BMV stock for auction bridges |
| Discount to asking (UK avg.) | 3.5% below asking (Q1 2026) | Margin for bridging costs on negotiated buys |
London borough bridging data (2026)
Five boroughs illustrate how different London markets suit different bridge strategies. Prices and rents reflect Q1-Q2 2026 data; yields and sales volumes help assess refinance and sale exits.
| Borough | Avg price | Yield | 12m price | Sales (12m) | HMO status | Best strategy |
|---|---|---|---|---|---|---|
| Croydon | £389k | 4.8% | -3.1% | 211 | High / Article 4 | Refurb, BTL, auction |
| Wandsworth | £672k | 4.6% | -4.6% | 200 | Medium / No A4 | Refurb, resale |
| Newham | £384k | 6.0% | -6.5% | 84 | High / Article 4 | BTL, HMO (with planning) |
| Barnet | £588k | 3.9% | -3.5% | 158 | High / Article 4 | Family homes, refurb |
| Barking & Dagenham | £361k | 5.6% | -0.8% | 62 | Varies | Lowest entry, BTL |
Highlights: Highest yield - Newham (6.0%). Most liquid - Croydon (211 sales). Lowest entry - Barking & Dagenham (£361k). Premium resale - Wandsworth (£672k).
Top 10 London Landlord Investment Data Points for 2026
Key property, rental, planning and risk data London landlords should check before investing, refinancing or using bridging finance.
Before investing in London, landlords should look beyond headline prices. The strongest deals are usually supported by borough-level yield, realistic rental evidence, Article 4 and licensing checks, sale-exit liquidity and a credible refinance or resale strategy.
2026 Landlord Data London BTL / HMO / Refurb / Bridge-to-Let| # | Data point | London 2026 snapshot | Why landlords should care | Bridging finance relevance |
|---|---|---|---|---|
| 1 | Average house price | Greater London average property price £542,000 in March 2026 (UK HPI, provisional). | Sets entry cost, equity buffer, LTV and likely bridge size across boroughs from £361k to £672k+. | Core input for purchase bridge sizing, valuation risk and refinance exit modelling. |
| 2 | Average private rent | Average monthly private rent £2,290 in April 2026 (ONS Price Index of Private Rents, provisional). | Helps estimate rental income and compare London boroughs against national landlord markets. | Supports bridge-to-let and BTL refinance stress testing before you commit. |
| 3 | Estimated gross yield | Approx. 5.1% gross yield at London average (rent × 12 ÷ price); borough sample range roughly 3.9% (Barnet) to 6.0% (Newham). | London capital values compress headline yield - borough selection matters more than the city-wide average. | Helps investors assess whether rental cover supports a BTL or HMO refinance exit. |
| 4 | Median rent by area (2-bed) | Median 2-bed flat rent: all London £1,800; Inner London £2,500; Outer London £1,725 (ONS ad-hoc, Apr 2025-Mar 2026). All-property average £2,290 (Apr 2026 ONS). | London rent varies sharply by inner/outer borough - use local medians, not a single city-wide bedroom average. | Important when modelling bridge-to-let income and refinance cover on flat-heavy stock. |
| 5 | Property type performance | London flats/maisonettes fell 5.5% YoY to £420k; terraced stock rose 1.3% YoY to £632k (Mar 2026 UK HPI). City-wide prices down 2.1% YoY. | Asset class drives exit strength - flats underperformed family terraces in 2026. | Match bridge strategy to asset type: terraced refurbs and resale may stack up better than flat-heavy exits. |
| 6 | Article 4 HMO restriction | Multiple boroughs including Newham, Barnet and Croydon operate Article 4 Directions. C3 to C4 HMO conversions need planning permission. | Proximity to universities or employment hubs does not automatically make an HMO viable. | HMO conversion bridges need planning buffer, licensing checks and confirmed exit lender appetite. |
| 7 | Borough HMO licensing | London boroughs run additional and selective HMO licensing schemes - requirements vary by borough and postcode. | Licensing cost, compliance and approval timelines differ across Greater London. | Licensing delays can push back letting, rental income and refinance timing on a bridge. |
| 8 | Transport-linked tenant demand | Elizabeth Line, Tube and rail access plus employment hubs (City, Canary Wharf, West End, King’s Cross) drive professional rental demand. | Commute time and transport links still move tenant demand and resale appeal in outer boroughs. | Strong demand supports bridge-to-let exits - especially in Newham, Croydon and well-connected corridors. |
| 9 | Sale-exit liquidity | London homes averaged ~41 days to sell in early 2026 (Zoopla). ~68,600 London sales in the 12 months to April 2026 (Land Registry sample). Croydon led sample boroughs on volume (211). | Liquidity varies sharply by borough and asset type - weak markets extend holding cost. | Sale exits need enough bridge term to cover slower boroughs; model days-on-market before you bid. |
| 10 | Regeneration and infrastructure | Key zones include Newham (Elizabeth Line), Croydon regeneration, King’s Cross, Nine Elms and Thamesmead. | Regeneration can support long-term demand, but delivery risk and construction-period disruption matter. | Refurbishment and value-add bridges may benefit from improving demand - verify timelines before pricing the exit. |
- London 2026 snapshot
- Greater London average property price £542,000 in March 2026 (UK HPI, provisional).
- Why landlords should care
- Sets entry cost, equity buffer, LTV and likely bridge size across boroughs from £361k to £672k+.
- Bridging finance relevance
- Core input for purchase bridge sizing, valuation risk and refinance exit modelling.
- London 2026 snapshot
- Average monthly private rent £2,290 in April 2026 (ONS Price Index of Private Rents, provisional).
- Why landlords should care
- Helps estimate rental income and compare London boroughs against national landlord markets.
- Bridging finance relevance
- Supports bridge-to-let and BTL refinance stress testing before you commit.
- London 2026 snapshot
- Approx. 5.1% gross yield at London average (rent × 12 ÷ price); borough sample range roughly 3.9% (Barnet) to 6.0% (Newham).
- Why landlords should care
- London capital values compress headline yield - borough selection matters more than the city-wide average.
- Bridging finance relevance
- Helps investors assess whether rental cover supports a BTL or HMO refinance exit.
- London 2026 snapshot
- Median 2-bed flat rent: all London £1,800; Inner London £2,500; Outer London £1,725 (ONS ad-hoc, Apr 2025-Mar 2026). All-property average £2,290 (Apr 2026 ONS).
- Why landlords should care
- London rent varies sharply by inner/outer borough - use local medians, not a single city-wide bedroom average.
- Bridging finance relevance
- Important when modelling bridge-to-let income and refinance cover on flat-heavy stock.
- London 2026 snapshot
- London flats/maisonettes fell 5.5% YoY to £420k; terraced stock rose 1.3% YoY to £632k (Mar 2026 UK HPI). City-wide prices down 2.1% YoY.
- Why landlords should care
- Asset class drives exit strength - flats underperformed family terraces in 2026.
- Bridging finance relevance
- Match bridge strategy to asset type: terraced refurbs and resale may stack up better than flat-heavy exits.
- London 2026 snapshot
- Multiple boroughs including Newham, Barnet and Croydon operate Article 4 Directions. C3 to C4 HMO conversions need planning permission.
- Why landlords should care
- Proximity to universities or employment hubs does not automatically make an HMO viable.
- Bridging finance relevance
- HMO conversion bridges need planning buffer, licensing checks and confirmed exit lender appetite.
- London 2026 snapshot
- London boroughs run additional and selective HMO licensing schemes - requirements vary by borough and postcode.
- Why landlords should care
- Licensing cost, compliance and approval timelines differ across Greater London.
- Bridging finance relevance
- Licensing delays can push back letting, rental income and refinance timing on a bridge.
- London 2026 snapshot
- Elizabeth Line, Tube and rail access plus employment hubs (City, Canary Wharf, West End, King’s Cross) drive professional rental demand.
- Why landlords should care
- Commute time and transport links still move tenant demand and resale appeal in outer boroughs.
- Bridging finance relevance
- Strong demand supports bridge-to-let exits - especially in Newham, Croydon and well-connected corridors.
- London 2026 snapshot
- London homes averaged ~41 days to sell in early 2026 (Zoopla). ~68,600 London sales in the 12 months to April 2026 (Land Registry sample). Croydon led sample boroughs on volume (211).
- Why landlords should care
- Liquidity varies sharply by borough and asset type - weak markets extend holding cost.
- Bridging finance relevance
- Sale exits need enough bridge term to cover slower boroughs; model days-on-market before you bid.
- London 2026 snapshot
- Key zones include Newham (Elizabeth Line), Croydon regeneration, King’s Cross, Nine Elms and Thamesmead.
- Why landlords should care
- Regeneration can support long-term demand, but delivery risk and construction-period disruption matter.
- Bridging finance relevance
- Refurbishment and value-add bridges may benefit from improving demand - verify timelines before pricing the exit.
Fast funding helps, but London investors should check borough yield, Article 4, licensing, sale-exit liquidity and asset-type performance before completion.
Estimated gross yield, borough yields and sales volumes are high-level indicators only. Sources include GOV.UK UK HPI (March 2026), ONS Private Rents (April 2026), ONS London rental market ad-hoc data, Zoopla and Lendlord borough sample data. Always validate with postcode-level comparables before purchase.
Interactive London Property Investment Map
Explore Greater London by borough boundary, yields, HMO licensing, Article 4 zones, Elizabeth Line and Tube access, universities, brownfield sites, flood risk and investor notes. Toggle layers in the filter panel to screen deals before you apply for bridging finance. Data is indicative - always verify with official sources.
Scroll to load map…London map data
| Layer | Area / location | Investor angle | Bridging use case | Exit route |
|---|---|---|---|---|
| Borough yield | Newham | 6.0% est. gross yield, £384k avg price | Bridge-to-let and HMO refinance | BTL or HMO mortgage once let |
| Borough yield | Croydon | 4.8% yield, strong auction liquidity | Auction and refurb bridges | BTL refinance or resale |
| Borough yield | Barking & Dagenham | Lowest sample entry at £361k | High-leverage purchase bridges | BTL refinance |
| Borough yield | Wandsworth | Premium £672k market | Refurb and resale bridges | Sale or high-value BTL exit |
| Article 4 | Newham / Barnet / Croydon | C3 to C4 HMO needs planning | HMO conversion bridge with planning buffer | HMO mortgage post-consent |
| Licensing | Newham / Croydon corridors | Additional and selective HMO schemes | Factor licence cost into bridge term | Let once licensed, then refinance |
| Transport | Elizabeth Line corridor | Stratford, Custom House, Woolwich demand | Professional let purchase bridges | BTL refinance |
| Universities | QMUL, UCL, Goldsmiths, Greenwich | Student and professional rental demand | Bridge-to-let near campuses | BTL or HMO refinance |
| Investor note | Stratford / Queen Elizabeth Park | Regeneration and Elizabeth Line uplift | Refurb value-add bridges | Resale or BTL at improved GDV |
| Investor note | Croydon town centre | Regeneration and auction stock | Auction and BRRR bridges | BTL refinance or resale |
| Investor note | Nine Elms / Battersea | Premium new-build and resale corridor | High-value purchase bridges | Sale or BTL at premium rent |
| Flood risk | Thames zones 2 & 3 | Insurance and lender appetite | Due diligence before bridge drawdown | Confirm lender acceptance pre-exit |
| Planning | Brownfield register | Regeneration potential | Development and refurb bridges | Sale or refinance at GDV |
This map is for editorial and research purposes only. Investors should verify licensing, planning, flood risk and local authority requirements with official sources before making a purchase decision.
Map data sources: ONS Open Geography Portal (London borough boundaries); ONS HPI & Private Rents (borough yields); London borough councils (HMO licensing & Article 4); TfL / Elizabeth Line; planning.data.gov.uk brownfield register; Environment Agency Flood Map for Planning; HESA university data; Lendlord editorial investor notes. Basemap: OpenFreeMap / OpenStreetMap.
How to assess a London bridge exit
Before you price a London deal, score the borough against seven data points that drive whether your bridge repays cleanly:
| Data point | Why it matters |
|---|---|
| Typical LTV appetite | Some boroughs and asset types fund more easily than others. Prime flats may cap at lower LTV; below-market terraced stock often supports higher leverage. |
| Estimated bridge rate range | Helps investors compare total cost, not just the headline monthly rate. |
| Typical valuation confidence | Prime, liquid boroughs usually have stronger comparable evidence, which speeds valuation and supports tighter pricing. |
| Refinance risk score | Based on yield, rent levels, property value and lender appetite for the asset class on exit. |
| Sale-exit risk score | Based on transaction volume, price trend and days-on-market. Weak liquidity extends holding cost. |
| Heavy refurb suitability | Flags areas where GDV uplift from works may justify funding the refurbishment in tranches. |
| Auction bridge suitability | Measures auction stock, typical discounts and post-auction liquidity for resale or refinance. |
Borough exit scores (indicative)
Scores are illustrative guides for deal screening, not lending decisions. Low = favourable, High = more caution needed.
| Borough | LTV appetite | Rate range p/m | Valuation confidence | Refinance risk | Sale-exit risk | Heavy refurb | Auction bridge |
|---|---|---|---|---|---|---|---|
| Croydon | High | 0.85-1.05% | High | Medium | Low | High | High |
| Wandsworth | Medium | 0.92-1.08% | High | Medium | Medium | Medium | Medium |
| Newham | High | 0.85-1.02% | Medium | Low | Medium | High | Medium |
| Barnet | Medium-High | 0.92-1.05% | High | Medium | Medium | High | Medium |
| Barking & Dagenham | High | 0.87-1.02% | Medium | Low | Higher | High | Medium |
Indicative scores only. Your actual rate and LTV depend on the property, works, exit and security. Model your deal on the bridging calculator.
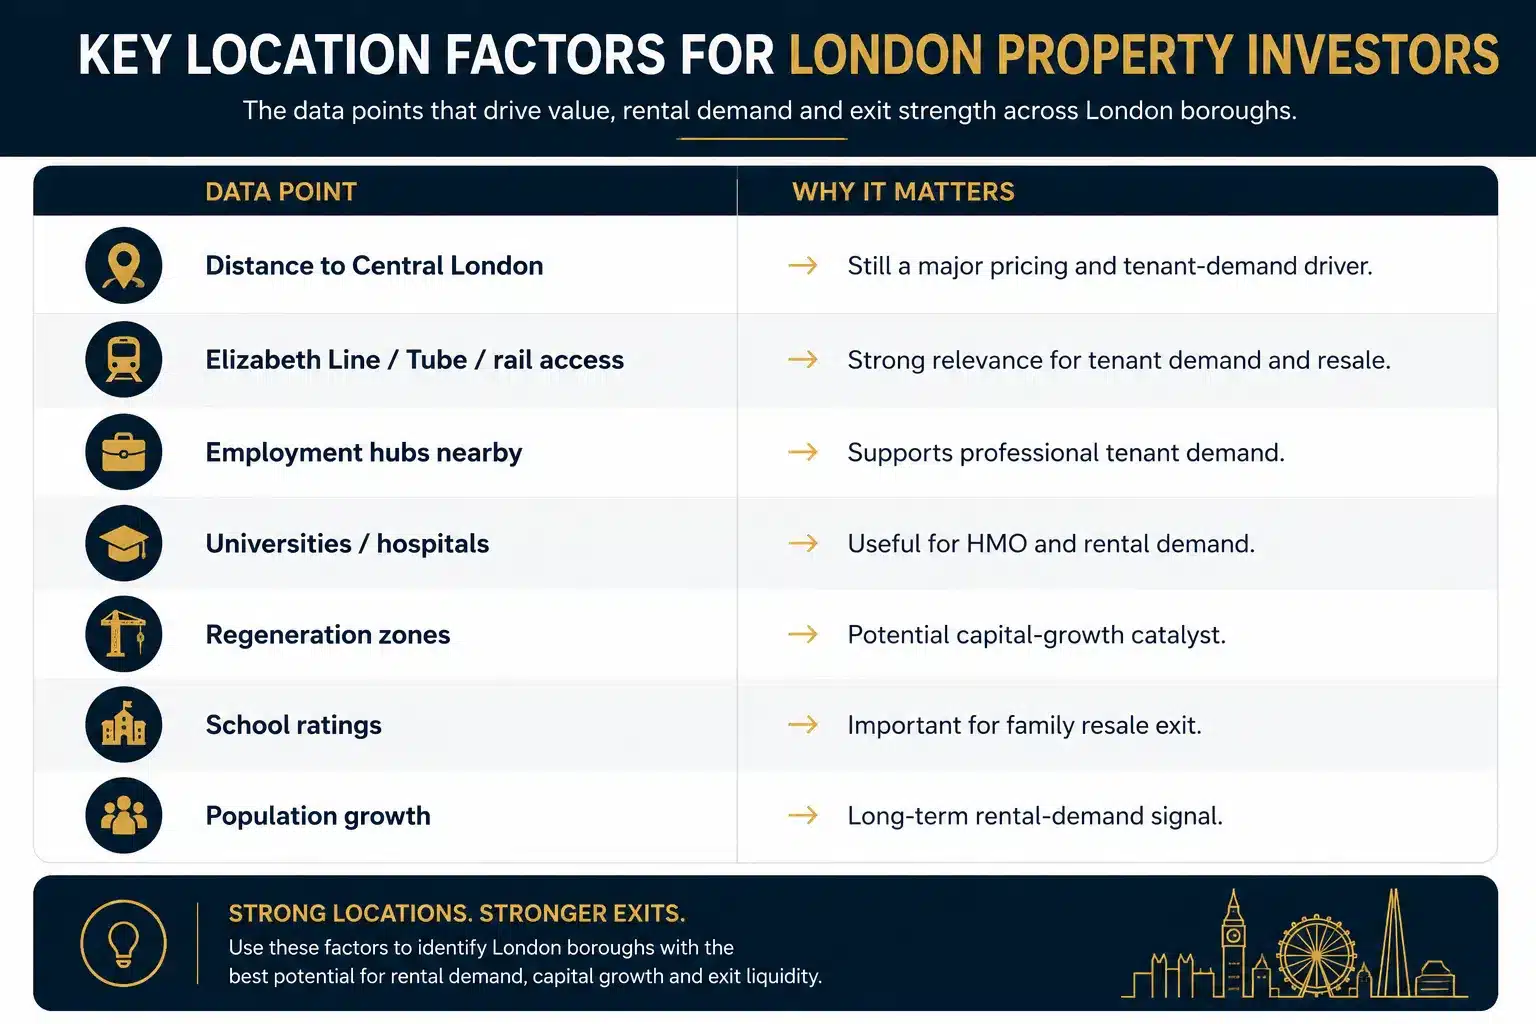
Key location factors across London boroughs
Price and yield are not the whole story. These location drivers affect tenant demand, resale strength and whether a refinance exit stacks up:
- Distance to Central London - still a major pricing and tenant-demand driver
- Elizabeth Line, Tube and rail access - strong relevance for tenant demand and resale (Newham, Croydon benefit directly)
- Employment hubs - Canary Wharf, City, West End and King's Cross corridors support professional tenant demand
- Universities and hospitals - useful for HMO and single-let rental demand
- Regeneration zones - potential capital-growth catalyst, but plan for construction-period risk
- School ratings - important for family-home resale exits (Barnet, Wandsworth)
- Population growth - long-term rental-demand signal across outer boroughs
London auction finance
London has one of the UK's deepest auction markets. Major houses including Allsop, Savills and McHugh & Co regularly offer residential and mixed-use lots across Greater London. When the hammer falls, you typically have 28 days to complete - which rules out standard mortgage timelines.
Lendlord funds London auction purchases at up to 75% of purchase price, or up to 90% of market valuation where the security supports it, with indicative terms returned the same day you apply. Pre-auction Heads of Terms are available so you can bid with confidence, then move straight to valuation and legals once you win the lot.
Refinance exits in London
Most London bridges exit onto a long-term mortgage once the property is let or refurbished. In 2026, that means matching asset class to lender appetite:
- High-yield boroughs (Newham 6.0%, Barking & Dagenham 5.6%) support stronger rental cover on refinance
- Article 4 boroughs (Newham, Barnet, Croydon) require HMO planning before conversion - factor this into your bridge term
- Flat-heavy markets saw sharper price falls (-5.5% YoY for London flats). Terraced and family stock held up better for resale exits
- Six-month rule - many BTL lenders want six months' ownership before remortgaging at post-works value; structure your bridge term accordingly
How much can you borrow in London?
| Facility | Maximum | Notes |
|---|---|---|
| Purchase price | Up to 75% of purchase price | Standard cap against what you pay |
| Market valuation | Up to 90% of market valuation | Where security and valuation support higher leverage |
| Refurbishment works | Up to 70% of GDV | Released in tranches against surveyor sign-off |
| Loan size | £30k to £3M | Direct lender, no broker fees |
| Term | 1 to 18 months | Structured around your exit |
Funding a London deal?
Get indicative London bridging terms in minutes - no obligation, no credit check.
Get Your Instant Quote Model Your CostsDirect lender • Greater London • No broker fees
London bridging finance - frequently asked questions
Can you get a bridging loan in London?
Yes. Lendlord funds bridging loans across Greater London for purchases, refurbishments, auction lots, HMO conversions and refinance exits. Loans from £30k to £3M at rates from 0.75% per month, with completion in as little as 5 working days.
How much can you borrow on a London bridging loan?
Lendlord lends up to 75% of purchase price, or up to 90% of market valuation. Purchase and refurbishment works can be funded in one facility, with up to 70% of GDV for the works element.
Which London boroughs suit bridging finance best?
It depends on your strategy. Croydon offers strong auction and refurb liquidity. Newham leads on rental yield for refinance exits. Wandsworth suits premium resale. Barking and Dagenham offers the lowest average entry price. Assess LTV appetite, exit risk and planning constraints borough by borough.
How fast can London bridging complete?
Lendlord returns indicative terms within minutes and can release funds in as little as 5 working days. Speed matters in London where auction deadlines and competitive purchases require certainty before you commit.
What is the typical exit on a London bridge?
The most common exits are refinance onto a buy-to-let or HMO mortgage once the property is let, or sale after refurbishment. London flat prices fell 5.5% year-on-year in March 2026 while terraced stock held up better, so matching exit type to asset class matters.
Do you charge broker fees on London bridging?
No. Lendlord funds London deals directly, so there are no broker fees or intermediary commissions on investor applications - you deal with the team pricing and completing your bridge.
Related bridging finance
Bridging loan deals case studies

Guides & tools
What Is a Bridging Loan?How bridging works, rates and uses Bridging Loan Rates 2026LTV tiers, fees and total cost Bridging CalculatorModel your London deal costsDeal types
Auction FinanceComplete inside the 28-day deadline Buy-to-Let BridgingClose fast, let and refinance Refurbishment BridgingPurchase plus works in one facility Unmortgageable Property BridgingFund stock standard lenders decline Chain Break BridgingBuy before you sell HMO Conversion FinanceArticle 4 areas and HMO exits BRRR Bridging FinanceBuy, refurbish, refinance, repeat Bad Credit BridgingCCJs, IVAs and defaults consideredOther UK locations
Bridging Loans CambridgeshireCambridge and county district data and deals Short Term Bridging Loans WiltshireSwindon and county district data and deals Bridging Loans BirminghamWest Midlands borough data and deals Bridging Loans ManchesterGreater Manchester borough data and deals Bridging Loans LeedsWest Yorkshire district data and deals Reviewed by Claire - Senior Bridging Specialist
12+ years in property finance - CeMAP qualified - London and South East specialist
Reviewed by Claire - Senior Bridging Specialist
12+ years in property finance - CeMAP qualified - London and South East specialist
About Lendlord
Lendlord is a UK PropTech platform that helps property investors source, analyse, fund, and manage property deals in one place. As a direct bridging lender, Lendlord provides bridging loans from £30k-£3M at rates from 0.75% pm, with completions from 5 days and no broker fees. The platform serves investors across the UK, US, and Canada, with tools including AI sourcing, BTL/BRRR/flip analysers, portfolio management, and Making Tax Digital compliance.
Commercial Property Awards 2026 Finalist. Property Reporter Awards 2022 Winner.
Lendlord is a direct lender of short-term property finance to UK investors. Borough scores, market data and map layers on this page are indicative guides for deal screening, not lending decisions or financial advice. Sources include GOV.UK UK HPI (March 2026), ONS Private Rents (April 2026) and Lendlord market analysis. Your property may be repossessed if you do not keep up repayments or repay the loan at the end of the term.