Tribunals Cut Most Challenged Rent Rises. What Do Landlords Actually Apply?
Published
5 min read

Do tribunals cut most challenged rises?
On 3 November 2026, reports on published tribunal decisions said a full award was the minority. In the September set of 74 cases, 21 were a full award, 28.4% of those cases. 71.6% of the 74 were not a full award.
What landlords applied is a different count. From Lendlord accounts approved for disclosure, the median applied rise is 6.33% on the tenancies recorded from 25 June 2026 to 31 October 2026. Decreases are not in that median.
Lendlord figures from accounts approved for disclosure: applied increases recorded 25 June to 31 October 2026, decreases not included. Tribunal figures are third-party analyses of published decisions, reported the same day.
What the tribunal numbers count
These shares are of tribunal cases, not of every rent rise in the country. September, as reported from Cyborg Finance: 74 cases.
| Outcome | Share of cases | Cases |
|---|---|---|
| Full award | 28.4% | 21 |
| Not a full award | 71.6% | of 74 |
| Partial | 39.2% | 29 |
| No change | 16.2% | of 74 |
| A reduction | 8.1% | of 74 |
| No rise at all | 32.4% | of 74 |
On 68 comparable September cases the rent moved from £1,372 to £1,464, a net 6.7%. October's block is 56 cases. A full award was 12 of them, 21.4%. 48 cases were compared, and the change on that set was 9.9%.
Property Investor Today gave figures drawn from Landlord Sums: 667 cases, a cut in 70%, a full award in 26%, an average ask of 14% and an average of 7.7% granted. Again, that is of challenged cases.
What landlords applied, region by region
The 6.33% national median includes Scottish tenancies. This table leaves Scotland out. South East and South West rest on few records. On a phone, read the rise column.
| Region | Median applied rise | Share of tenancies |
|---|---|---|
| East Midlands | 6.54% | 8.3% |
| East of England | 4.36% | 9.1% |
| Greater London | 6.17% | 14.3% |
| North West | 6.46% | 21.6% |
| South East | 7.9% | 4.0% |
| South West | 8.11% | 5.0% |
| West Midlands | 6.92% | 8.1% |
| Yorkshire and the Humber | 11.2% | 15.1% |
Yorkshire and the Humber is the high row at 11.2%. East of England is the low row at 4.36%. Serve the notice on the prescribed form, with the evidence attached.
The notice
Put the evidence on the form before you serve it
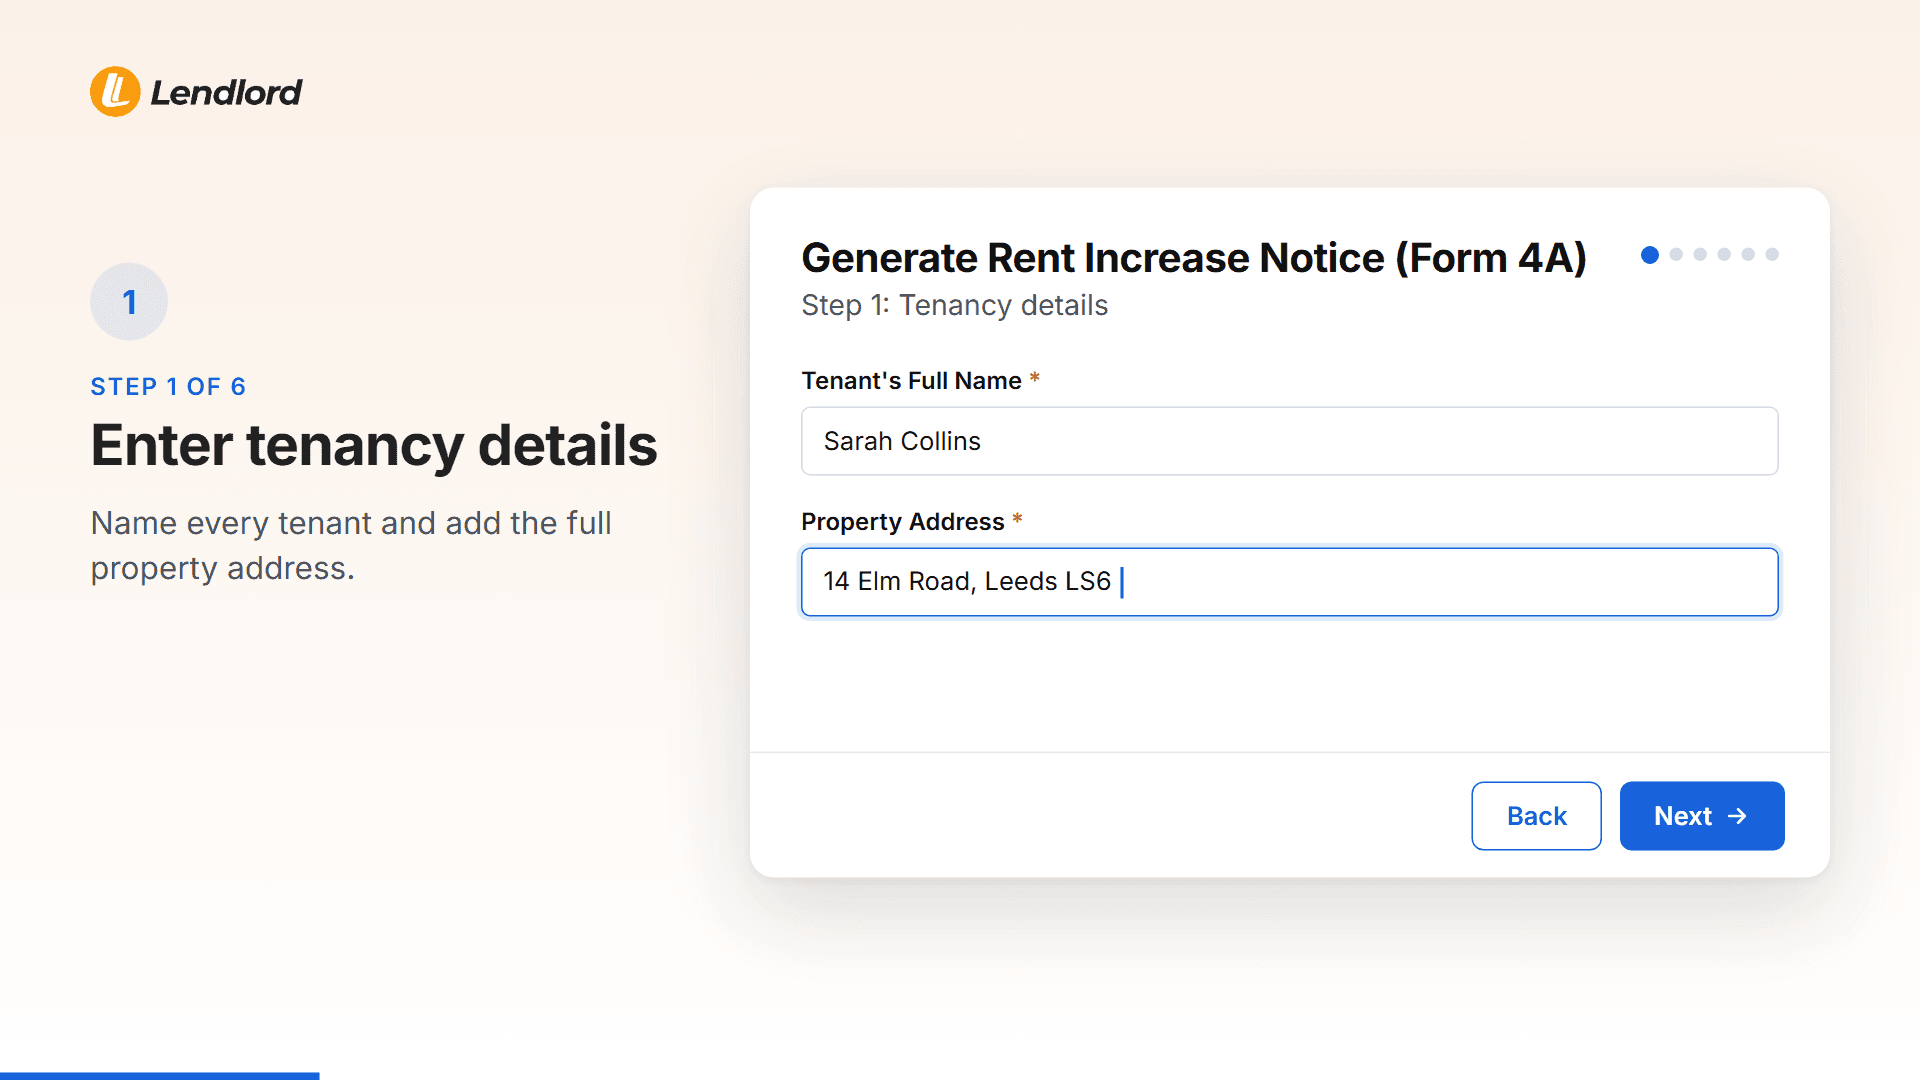
The median is a check. The figure you serve should match the lets you can show.
Open the noticeSmaller portfolios apply bigger rises
The same window, split by portfolio size. The gap from the smallest band to the largest is 3.21 points.
| Portfolio size | Median applied rise | Share of tenancies |
|---|---|---|
| 1 to 3 | 9.09% | 10% |
| 4 to 10 | 6.79% | 36% |
| 11 to 20 | 6.25% | 17% |
| 21 or more | 5.88% | 37% |
A 1 to 3 portfolio applied 9.09%, but that band holds only 10% of the tenancies. The largest band applied 5.88% and holds 37%. Price the rise from the lets nearby. A bigger book has more of those lets on file.
Platinum Property Academy runs its own portfolio on Lendlord.
…it tracks compliance, deadlines, rent reviews and ROI automatically.Platinum Property Academy, Instagram, 1 May 2026
View this post on Instagram
The review date is the useful part. A rise with no dated comparables is the one that slips.
Where applied rents moved
Beside the official rent index
ONS publishes England and Wales separately. The England reading is 4.0%, and the average rent there is £1,466. Wales is 4.1%. The UK reading is 3.8%, on an average rent of £1,406.
ONS tracks every rent in the stock, rises and falls. The Lendlord median counts applied increases only, since 25 June 2026. The two are side by side so you can see the bases. They are not a gap to quote.
| Place | Applied rise | ONS |
|---|---|---|
| UK | 6.33% | 3.8% |
| North West | 6.46% | 5.7% |
| London | 6.17% | 3.5% |
| South East | 7.9% | 3.5% |
An illustration on the official average
On the £1,466 average, a 6.33% rise is about £93 a month. That is an illustration on the ONS average, not a Lendlord rent.
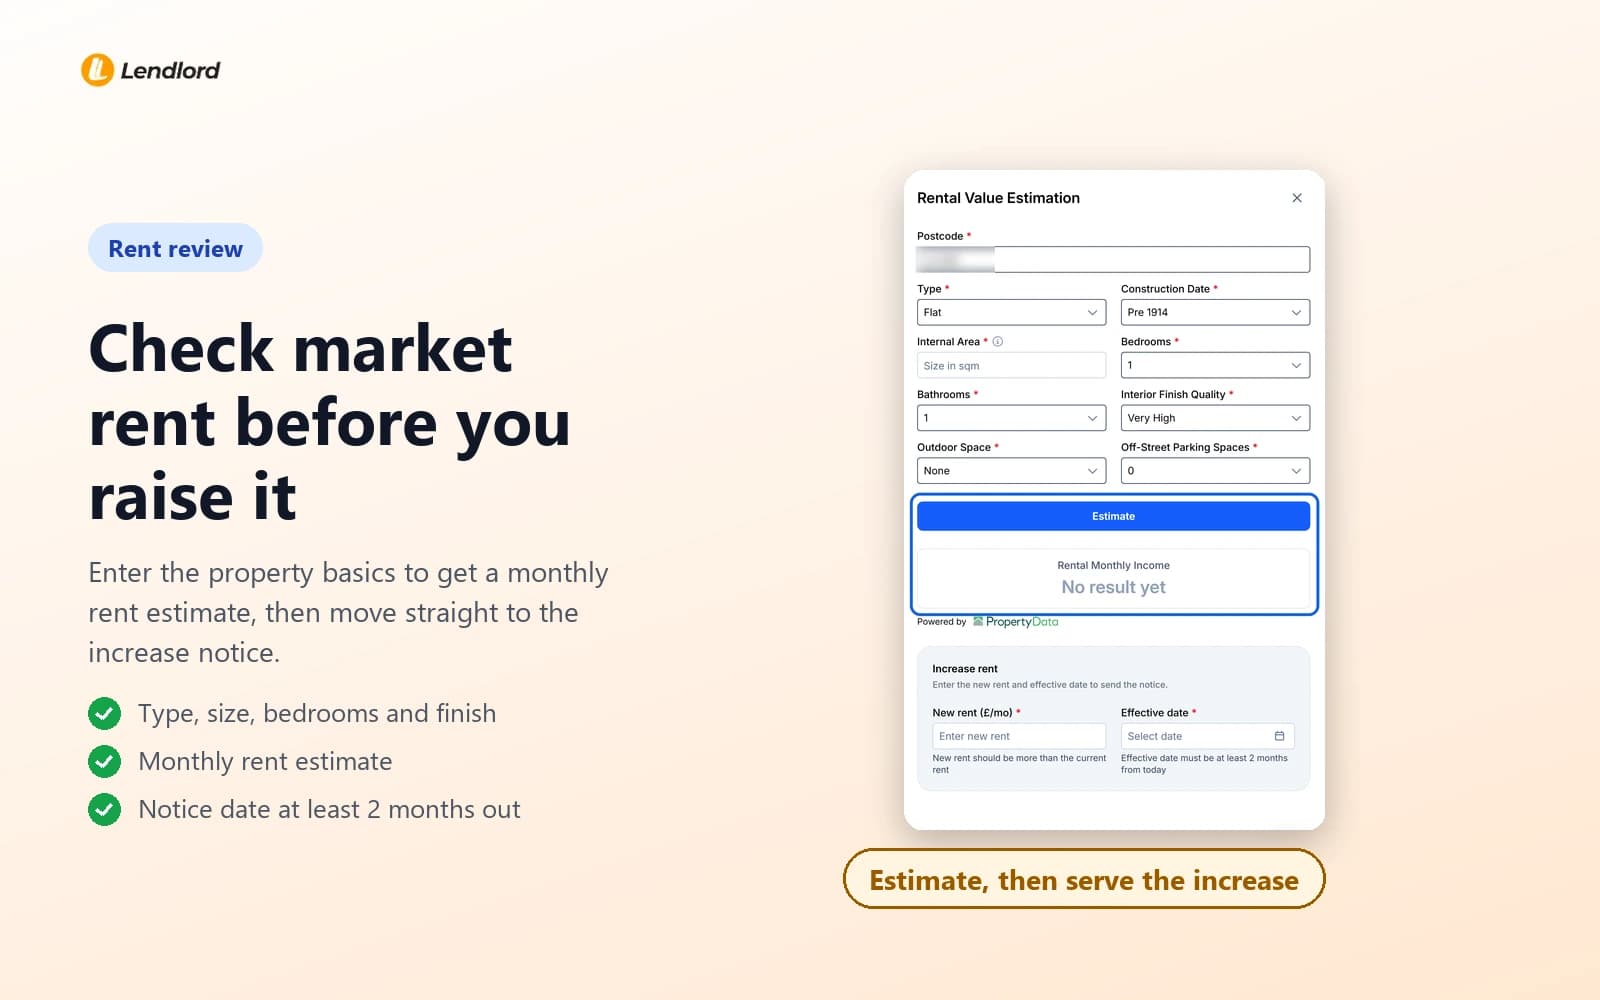
Before you pick the new figure, check the rent estimate for that home. The tribunal's figure is the open market rent. How estimated rents compare with what homes let for is the longer cut.
What a challenge costs in time
Cyborg Finance put the average wait from notice to decision at 91 days. From 1 May 2026 the new rent is the lower of the determined rent and the proposed rent.
Form 4A needs at least 2 months' notice. How a tenant's challenge runs, step by step covers the process.
Before you pick a figure
Five checks before you serve
The median is a starting point. The notice needs evidence.
- Three dated comparable lets near the home.
- A planned rent that those lets can support.
- Form 4A served at least 2 months ahead.
- No other Section 13 increase on this tenancy in the same year.
- The evidence filed where you can find it if the tenant applies.
The 2026 rules for Section 13 increases set the yearly limit. Prepare the Form 4A notice once the comparables are dated.
Applied rises: Lendlord accounts approved for disclosure, 25 June to 31 October 2026, decreases excluded. The national median includes Scottish tenancies. The regional table does not. Tribunal shares are of published decisions, reported that day. Region cells with few records are named in the text. This is not a personal rent.
Set the figure from the lets you can show
A regional median will not be the evidence in a challenge. Your comparables will.
Check a rent figure
Expert insight from Aviram Shahar, Co-Founder and CEO of Lendlord. PropTech entrepreneur. Last updated November 2026. Price the rise on evidence and it holds. The median is the check, not the notice.
Official data sources
- ONS private rent and house prices, October 2026
- Residential property tribunal decisions
- GOV.UK rent increases
- Apply for an open market rent determination
- Renters' Rights Act 2025 explanatory notes
- Cyborg Finance, rent tribunal decisions
- Property Wire report on the September cases
- Landlord Today report on the September cases
- Property Investor Today report on Landlord Sums