Modelled Rents Run 13.7% Above What Let Homes Collect
Published
5 min read
You hold one to ten properties, and you are pricing the next purchase at £150,000. The modelled rent in the Deal Analyser is £1,023 a month, from an agent, a listing or your own guess. Yield, mortgage interest cover and the cash left each month all sit on that rent line.
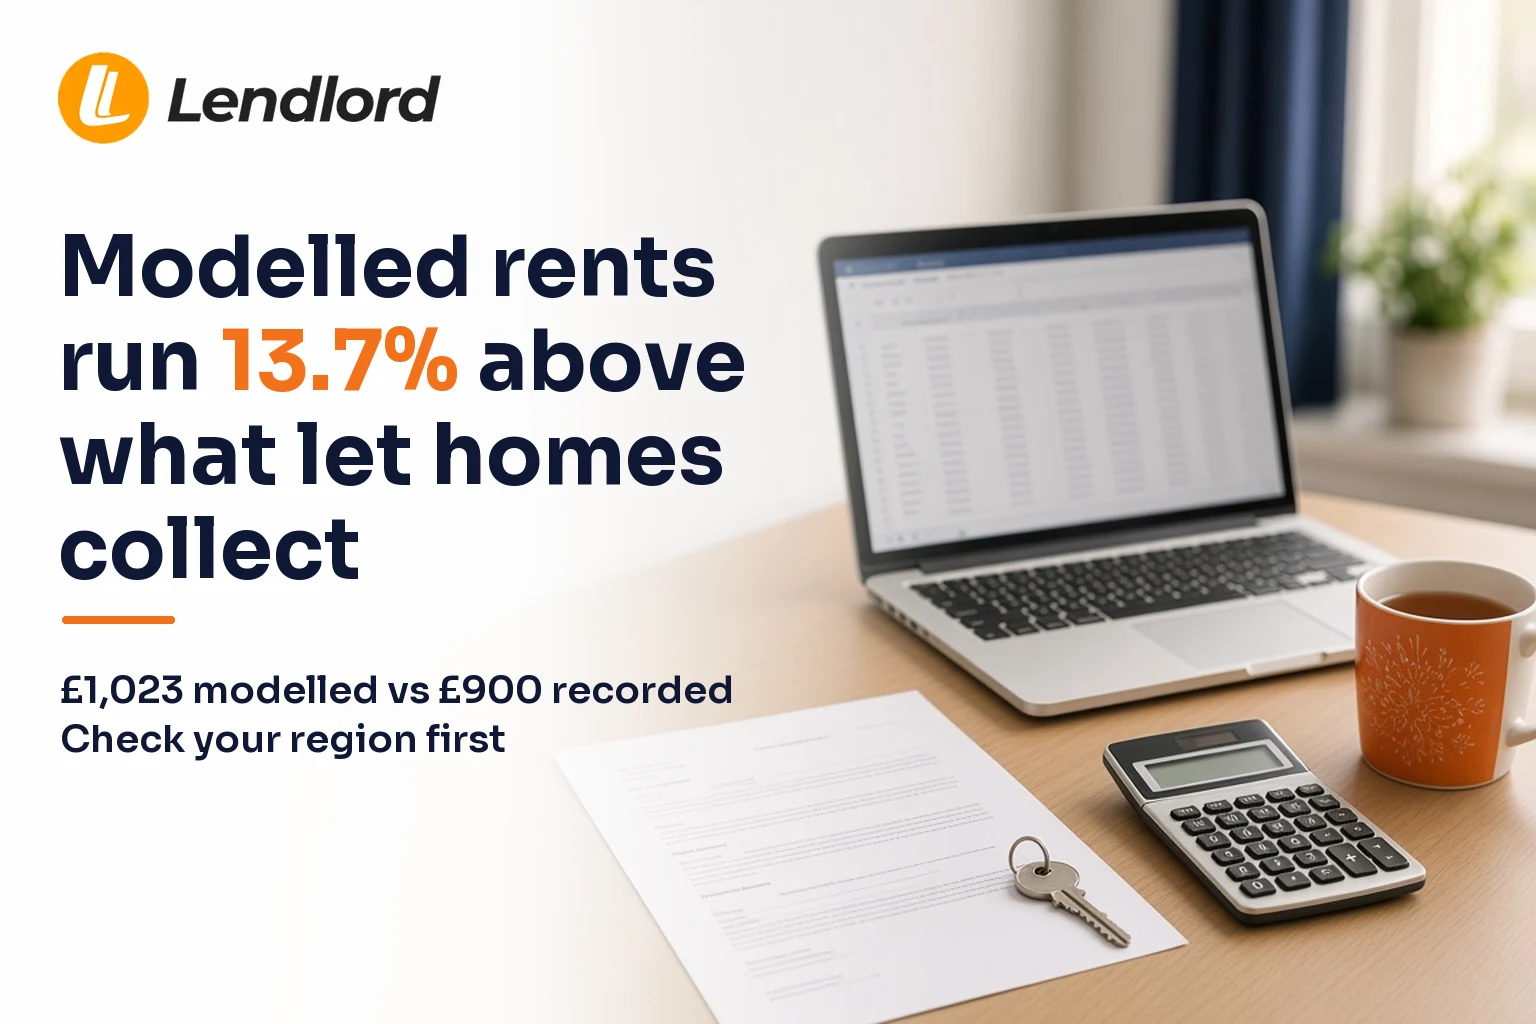
Across 5,535 saved analyses, the median modelled rent is £1,023. Let homes on Lendlord collect a median recorded rent of £900. Modelled rent sits 13.7% above recorded rent, a gap of £123 a month.
Modelled rent is the rent a landlord typed into an analysis before buying. Recorded rent is the monthly rent stored against let homes. The median is the middle value, so half the figures sit above it and half sit below.
These are two different sets of homes, so the gap is a check before you offer, not a verdict on your deal. Next you can compare your region, see why a post-works figure is not like for like, and test what £123 a month does to the yearly rent.
Figures last checked on 30 September 2026, against saved analyses for the 12 months to that date and let homes recorded that day.
The gap, region by region
The national gap is 13.7%, and your region may be much wider or almost flat.
| Region | Modelled rent | Recorded rent | Gap |
|---|---|---|---|
| West Midlands | £1,100 | £900 | 22.2% |
| East Midlands | £1,050 | £875 | 20.0% |
| East of England | £1,300 | £1,095 | 18.7% |
| North East | £750 | £650 | 15.4% |
| North West | £950 | £825 | 15.2% |
| Yorkshire and Humberside | £850 | £750 | 13.3% |
| Scotland | £800 | £715 | 11.9% |
| Northern Ireland | £800 | £725 | 10.3% |
| South West | £1,250 | £1,150 | 8.7% |
| South East | £1,354 | £1,250 | 8.3% |
| Wales | £852 | £795 | 7.2% |
| Greater London | £1,850 | £1,837 | 0.7% |
Source: 5,535 analyses saved by landlords on Lendlord, from 1 October 2025 to 30 September 2026. Recorded rent covers 23,952 let homes with rent above zero on 30 September 2026. Northern Ireland rests on 16 analyses, so treat that row as thin. This describes landlords on Lendlord, not the whole UK market.
West Midlands leads on the percentage, at 22.2%, with East Midlands at 20.0%, so stress modelled rent harder there before you model the deal. Greater London is 0.7%, and the largest pound gap is East of England at £205 a month, not the Midlands.
Your next purchase
Rerun the purchase on your row

Put your region's recorded rent on the rent line and see whether the yield still holds.
Open the buy-to-let calculatorWhy BRRR and flip numbers differ
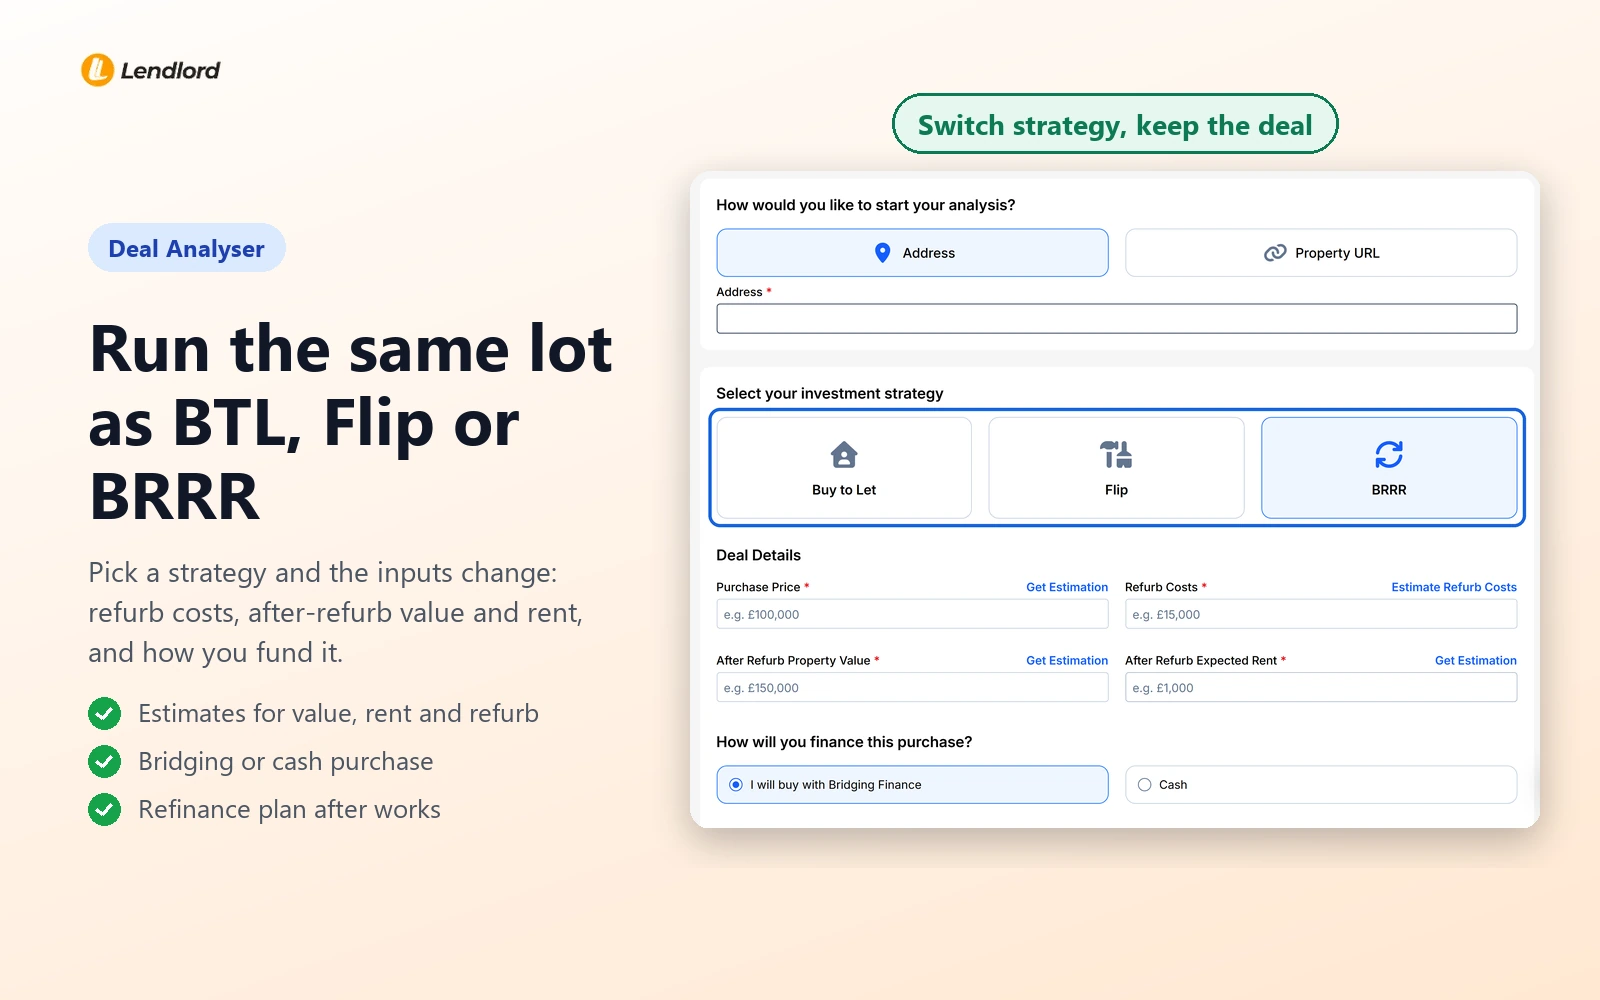
Of the 5,535 saved analyses, 48.8% are buy-to-let, 34.9% are BRRR and 16.2% are flips. BRRR means buy, refurbish, rent, refinance. A flip means buy, refurbish and sell.
The median BRRR case puts a rent of £1,050 on a £125,500 purchase, across 1,934 analyses. Buy-to-let uses the same £1,050 on a £155,000 price, across 2,702 analyses. A flip uses £878 on £172,500, across 899 analyses.
BRRR modelled rent is usually the rent after the works, not what let homes collect today. Recorded rent is current rent on homes already owned. The two are not like for like, so a post-works figure can sit further from recorded rent than a buy-to-let figure.
For the sale maths on a flip, see how flip margins are worked out. For the refinance step, use the BRRR calculator and keep the post-works rent on its own line. In Greater London, 25.1% of 626 analyses are buy-to-let, 43.0% are BRRR and 31.9% are flips.
What £123 a month does to your numbers
This illustration places two medians on one £150,000 price. It is not one real property. Gross yield is annual rent as a share of the purchase price, before any costs.
At a modelled rent of £1,023 the year is £12,276, and £12,276 divided by £150,000 is a gross yield of 8.2%. At a recorded rent of £900 the year is £10,800, which is a gross yield of 7.2%. The monthly gap of £123 times 12 is £1,476 a year.
ICR, the interest cover ratio, is rent divided by mortgage interest, as lenders test it. If cover only passes at £1,023, it may fail at £900.
Costs take a further slice after gross yield. See how far net yield falls below gross before you treat 8.2% as money you keep. Net yield is annual rent after running costs and mortgage interest, as a share of the price.
On your own purchase, multiply the monthly shortfall by 12. That product is the yearly rent at risk. Then run gross yield at your modelled rent and again at the region's recorded rent, both on your price.
Run a deal from price to yield
Three checks before you trust a rent estimate
Tick each line before you trust the rent in the analysis.
- Compare your modelled rent with the recorded rent for your region in the table.
- Ask a local letting agent for a written rent valuation, not a listing headline.
- Rerun the analysis at that recorded rent, then rerun the lender stress test, and see if interest cover still passes.
A listing headline is an asking rent. A written valuation names the rent the agent would market and the rent they expect you to collect.
Ask a broker if interest cover fails at the lower rent. Ask a solicitor if the offer turns on a rent promise. Ask an accountant when you need the tax on that rent, because this gap does not calculate it.
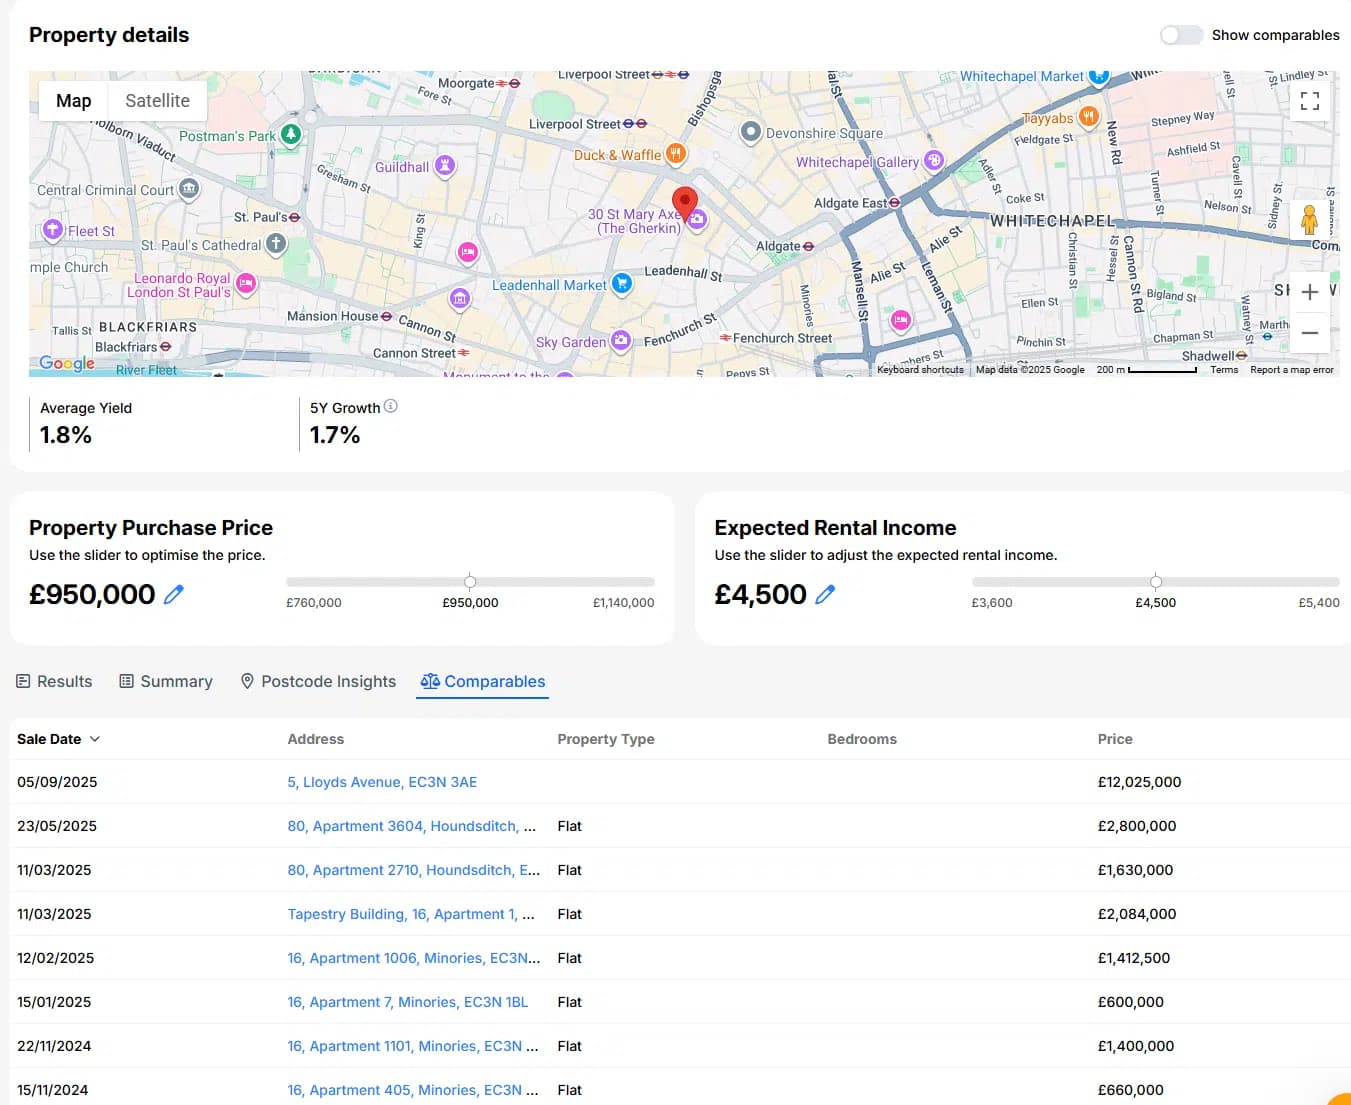
Saved analyses are prospects, not purchases: 5,535 of them, saved by landlords on Lendlord between 1 October 2025 and 30 September 2026. Recorded rent is a different set: 23,952 let homes with rent above zero on 30 September 2026.
Property type and condition differ. Analysis status is self-reported and often left unchanged. These figures describe landlords on Lendlord, not the whole UK market.
Save both versions of the case
Save the case at the rent you were given, then again using your region's row.
Save an analysis
Expert insight from Aviram Shahar, Co-Founder and CEO of Lendlord · PropTech entrepreneur · Last updated October 2026.
The rent line carries the whole analysis. Model the deal at the region's recorded rent before you offer, and ask a broker to check interest cover if only the higher rent passes.
Official data sources
Use these for the wider rent and rate picture. The medians above come from Lendlord.