Is Your Rental Portfolio Profitable? The Median Nets £11,471
Published · Updated
4 min read

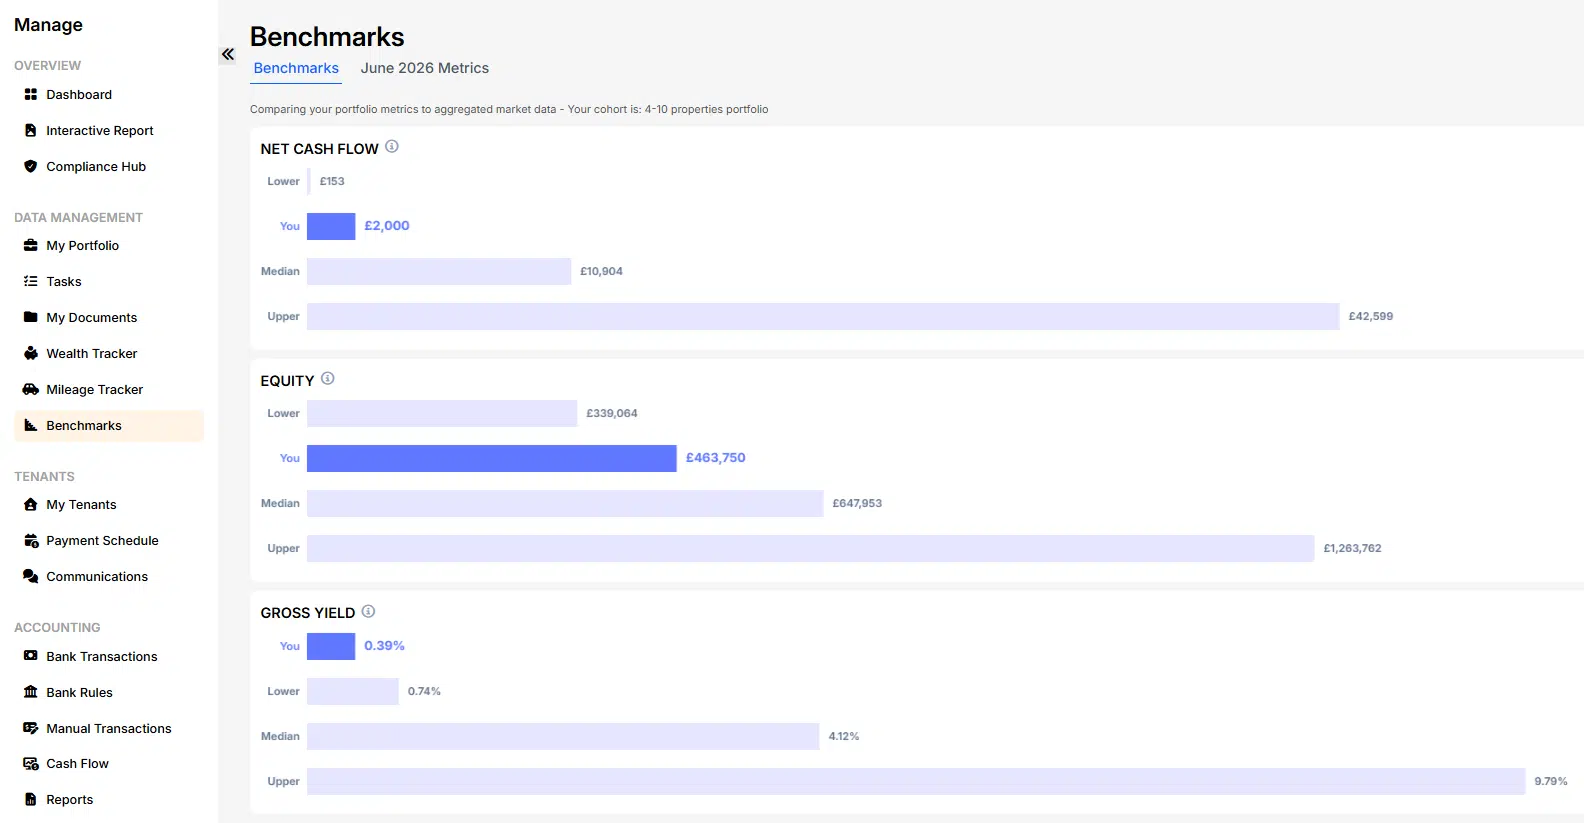
In Lendlord Benchmarks for September 2026, portfolios of four to ten properties show median net cash flow of £11,244 a year. The lower band is -£314.
For most of the cohort that is still profitable, but by far less than gross yield suggests. The upper band cleared £43,446.
Below are the six measures Lendlord tracks for that cohort, the gap between gross and net yield, and the rate move that would wipe out half of a median year.
Bands last checked September 2026 against the September 2026 Benchmarks snapshot. This article publishes the four to ten property cohort; three other size bands sit in Lendlord Data.
Before you compare
Bands only help once your own numbers are current
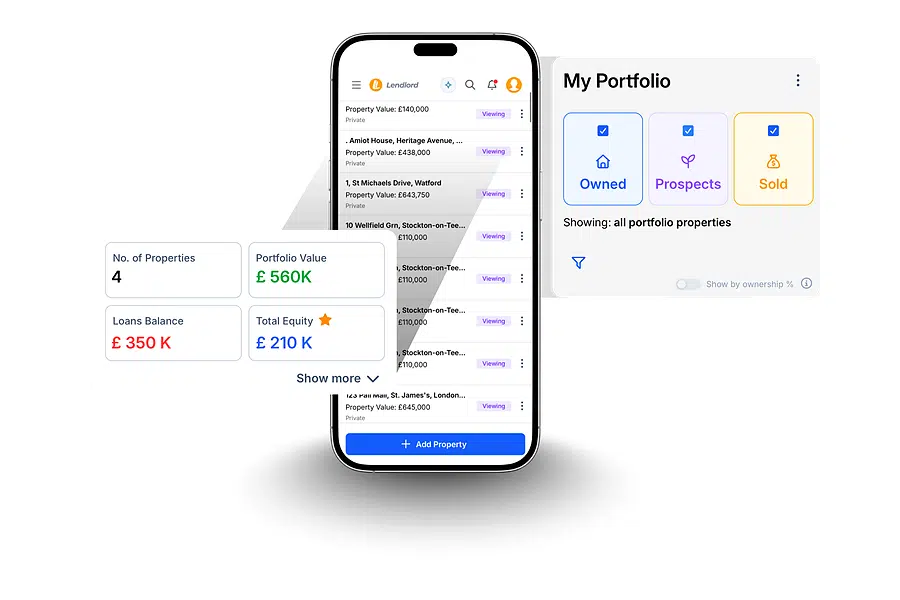
Rent, mortgage payments and running costs sit against each property. The portfolio total updates as the year runs, not at tax time.
Open a free accountThe six measures, lower to upper
Each row is a band across the cohort, not a single landlord followed down the table. The portfolio sitting in the lower cash-flow band is not necessarily the one carrying 62.18% leverage.
| Measure | Lower | Median | Upper |
|---|---|---|---|
| Net cash flow | -£314 | £11,244 | £43,446 |
| Equity | £339,177 | £653,504 | £1,256,790 |
| Gross yield | 0.78% | 4.20% | 10.13% |
| Net yield | -0.08% | 1.54% | 5.51% |
| Portfolio LTV | 23.01% | 44.68% | 62.18% |
| Average interest rate | 2.66% | 3.77% | 4.93% |
Source: Lendlord Benchmarks, September 2026 period, portfolios of four to ten properties. Lower, median and upper bands rather than averages.
Equity is where this cohort looks strongest. A median of £653,504 against a median LTV of 44.68% means most of these portfolios are only about half borrowed. The income line is the tight one, not the balance sheet.
Gross yield flatters nearly everyone
Median gross yield is 4.20%. Median net yield is 1.54%. That gap of 2.66 points is mortgage interest, management, maintenance, insurance and voids.
Put it in pounds. On £250,000 of purchase costs, 4.20% gross is about £10,625 of rent a year. At 1.54% net, roughly £3,900 of that survives. The other £6,700 leaves before you see it.
This is why a headline yield quoted by an agent rarely matches the bank balance. Gross yield prices the asset. Net yield pays you.
The lower band is not breaking even
Net yield in the lower band is -0.08%. Net cash flow is -£314. That is close to zero rather than a disaster, but it is a full year of ownership for nothing.
A portfolio can land there on rent that never moved while costs did. It can also land there after one bad void or a boiler year. The useful question is which of those you are looking at, because only one of them repeats.
Near break-even is a rate-risk position, not a steady state. A portfolio at -£314 has no buffer left for the next fix.
Why cash flow comes before the growth story
The rate reset sitting under the median
Median average interest across the cohort is 3.77%, with an upper band of 4.93%. Plenty of that is older fixed-rate debt still running at yesterday's pricing.
Work out what a reset costs before it arrives. On £400,000 of borrowing, moving from 3.77% to 5.25% adds about £5,880 a year. Against median net cash flow of £11,244, that is more than half the year gone.
Run your own version against lender criteria with the BTL stress test and ICR calculator. For the fix-length decision, the remortgage maths after the Bank of England hold walks through the trade-off.
How to place your own portfolio in the bands
Five steps, once a quarter. It takes longer the first time because the data has to be complete.
- Total the rent actually received in the last twelve months, not the rent on the agreements.
- Subtract mortgage interest, management, maintenance, insurance, service charges and ground rent.
- Divide that net figure by your total purchase costs to get net yield.
- Check your blended interest rate against the 3.77% median, then note when each fix ends.
- Repeat after the next renewal so you can see direction, not just position.
If the answer sends you looking for the next purchase, the numbers that matter change. Use the guide to underwriting the next purchase for that side of the decision.
Lendlord Benchmarks aggregate portfolio data by cohort and report lower, median and upper bands. Figures here cover the September 2026 period for portfolios of four to ten properties. Bands are per measure, so a landlord in the lower band on one row can sit in the upper band on another.
Want your own number against these bands?
Add your properties, rents and mortgages, and the portfolio figures update as the year runs.
Start free and track your portfolio
Expert insight from Aviram Shahar, Co-Founder and CEO of Lendlord · PropTech entrepreneur · Last updated September 2026
Aviram reads these bands from the bottom up. The median tells you what the market is doing. The lower band tells you what a bad year looks like when rates move against you. Model that year first, then decide whether the next purchase is affordable.