Buy to Let, Flip or BRRR: Which Do Landlords Model in Your Region?
Published · Updated
5 min read

Buy to let, flip or BRRR: what do landlords model?
Across saved analyses checked on the 31 October 2026 export, buy to let leads in most regions. BRRR leads in Wales at 51.3%, in the South West at 43.1%, and in Greater London at 39.8%. Greater London also has the highest flip share, 35.2%.
The national mix, once: buy to let 48.2%, BRRR 34.9%, flip 16.9%. How modelled rents compare with what let homes collect covers that national cut in more depth. The median purchase across all saved analyses is £145,000. These are saved analyses, not purchases.
Saved analyses from Lendlord accounts approved for disclosure, 1 November 2025 to 31 October 2026. Figures checked against the 31 October 2026 export.
The strategy mix, region by region
Sorted by the let share, highest first. Northern Ireland rests on few analyses, so that row is thin. On a phone, read the let share and the price.
| Region | Buy to let | BRRR | Flip | Median purchase price | Share of analyses |
|---|---|---|---|---|---|
| North West | 62.1% | 28.7% | 9.1% | £125,000 | 16.2% |
| West Midlands | 58.2% | 27.7% | 14.1% | £160,000 | 8.4% |
| East Midlands | 53.5% | 33.3% | 13.2% | £145,000 | 8.3% |
| North East | 51.2% | 41.4% | 7.4% | £80,000 | 7.3% |
| Scotland | 51.2% | 38.9% | 9.9% | £85,000 | 5.1% |
| Yorkshire and the Humber | 47.2% | 35.4% | 17.4% | £110,000 | 10.5% |
| South East | 44.4% | 33.6% | 22.0% | £205,000 | 8.0% |
| Northern Ireland | 43.8% | 50.0% | 6.2% | £90,000 | 0.3% |
| East of England | 42.6% | 33.8% | 23.5% | £190,000 | 4.9% |
| South West | 40.8% | 43.1% | 16.1% | £170,150 | 3.8% |
| Wales | 29.8% | 51.3% | 18.8% | £110,000 | 6.0% |
| Greater London | 25.0% | 39.8% | 35.2% | £285,000 | 11.7% |
A cheaper price does not mean the BRRR tab. The North East median is £80,000 and the let share there is 51.2%. A low price is not, by itself, a brief to refurb and refinance.
Wales is the BRRR row, at 51.3% and a median price of £110,000. Save the address on all three tabs before you book the viewing. Run the tab your region uses less often before you decide the deal is different.
One address
Run the strategy your region rarely saves
The table is what was modelled. Your address still needs its own works, rent and exit.
Open the flip calculatorWhat changes as the portfolio grows
The let share for a smaller book, then a mid-size book. Small cells move a lot. Scotland's mid-size cell rests on few analyses, so read 90.6% lightly. Two other mid-size cells are concentrated, so they stay out of this table.
| Region | 1 to 3 | 4 to 10 |
|---|---|---|
| West Midlands | 48.5% | 85.2% |
| South East | 52.9% | 69.4% |
| Yorkshire and the Humber | 47.4% | 61.8% |
| Greater London | 26.1% | 57.1% |
| Scotland | 37.1% | 90.6% |
| North West | 72.3% | 67.1% |
In the West Midlands the share moves from 48.5% to 85.2%. That is 36.7 points. The North West moves the other way, from 72.3% to 67.1%. A bigger book in one region is not a script for the next.
Why BRRR starts cheaper
The BRRR median purchase is £120,000. Buy to let is £150,000. Flip is £170,000. The let median sits £30,000 above the BRRR price. Flip sits £20,000 above the let price.
A BRRR case starts from a home that needs work, so the purchase is lower. The rent entered is usually the rent after works. That BRRR rent is £1,050 against a let rent of £1,020, a gap of £30.
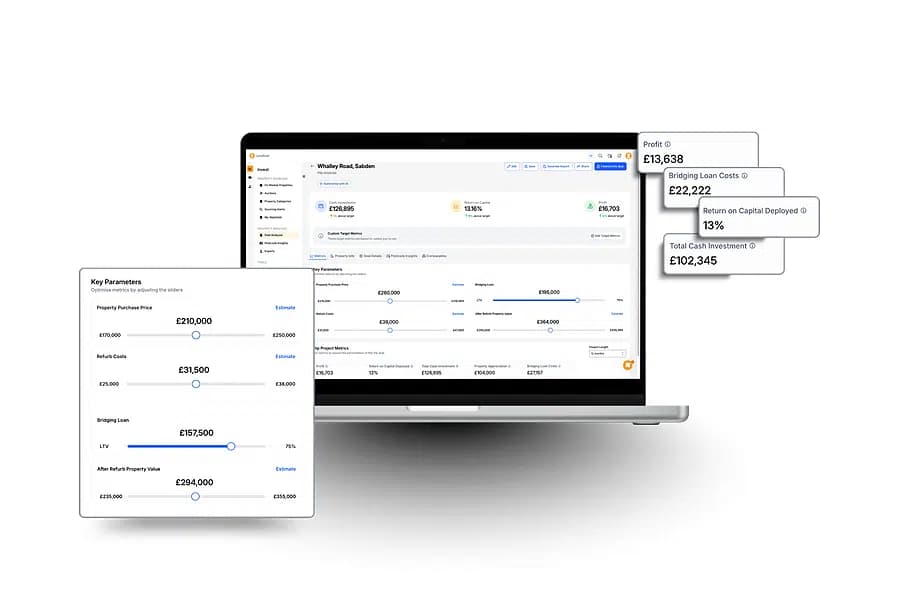
Do not read the £30 as profit. One of those rents is usually post-works. Model the refinance in the BRRR calculator once you have a written view of the value after the works.
Jamie York, a property educator who runs deal numbers in Lendlord, put the next step like this:
…and repeat. So that's BRR in a nutshell. So let's jump into a real deal. To do this, I'm going to jump into Lendlord, which is my preferred software that I use for my property analysis so we can break down the numbers.Jamie York, YouTube, 31 Oct 2025 (Lendlord partner)
Jamie York on the BRRR numbers
One property, three tabs
Take a Yorkshire and the Humber case at the regional median of £110,000, then replace it with your asking price. Run the let tab at that price.
Run the BRRR tab with a refurb budget and an after-works value from a local agent or a surveyor. Run the flip tab with a sale value from sold prices, not from asking prices. Compare cash left in, monthly cash flow and the exit. Leave the refurb figure blank until you have it.
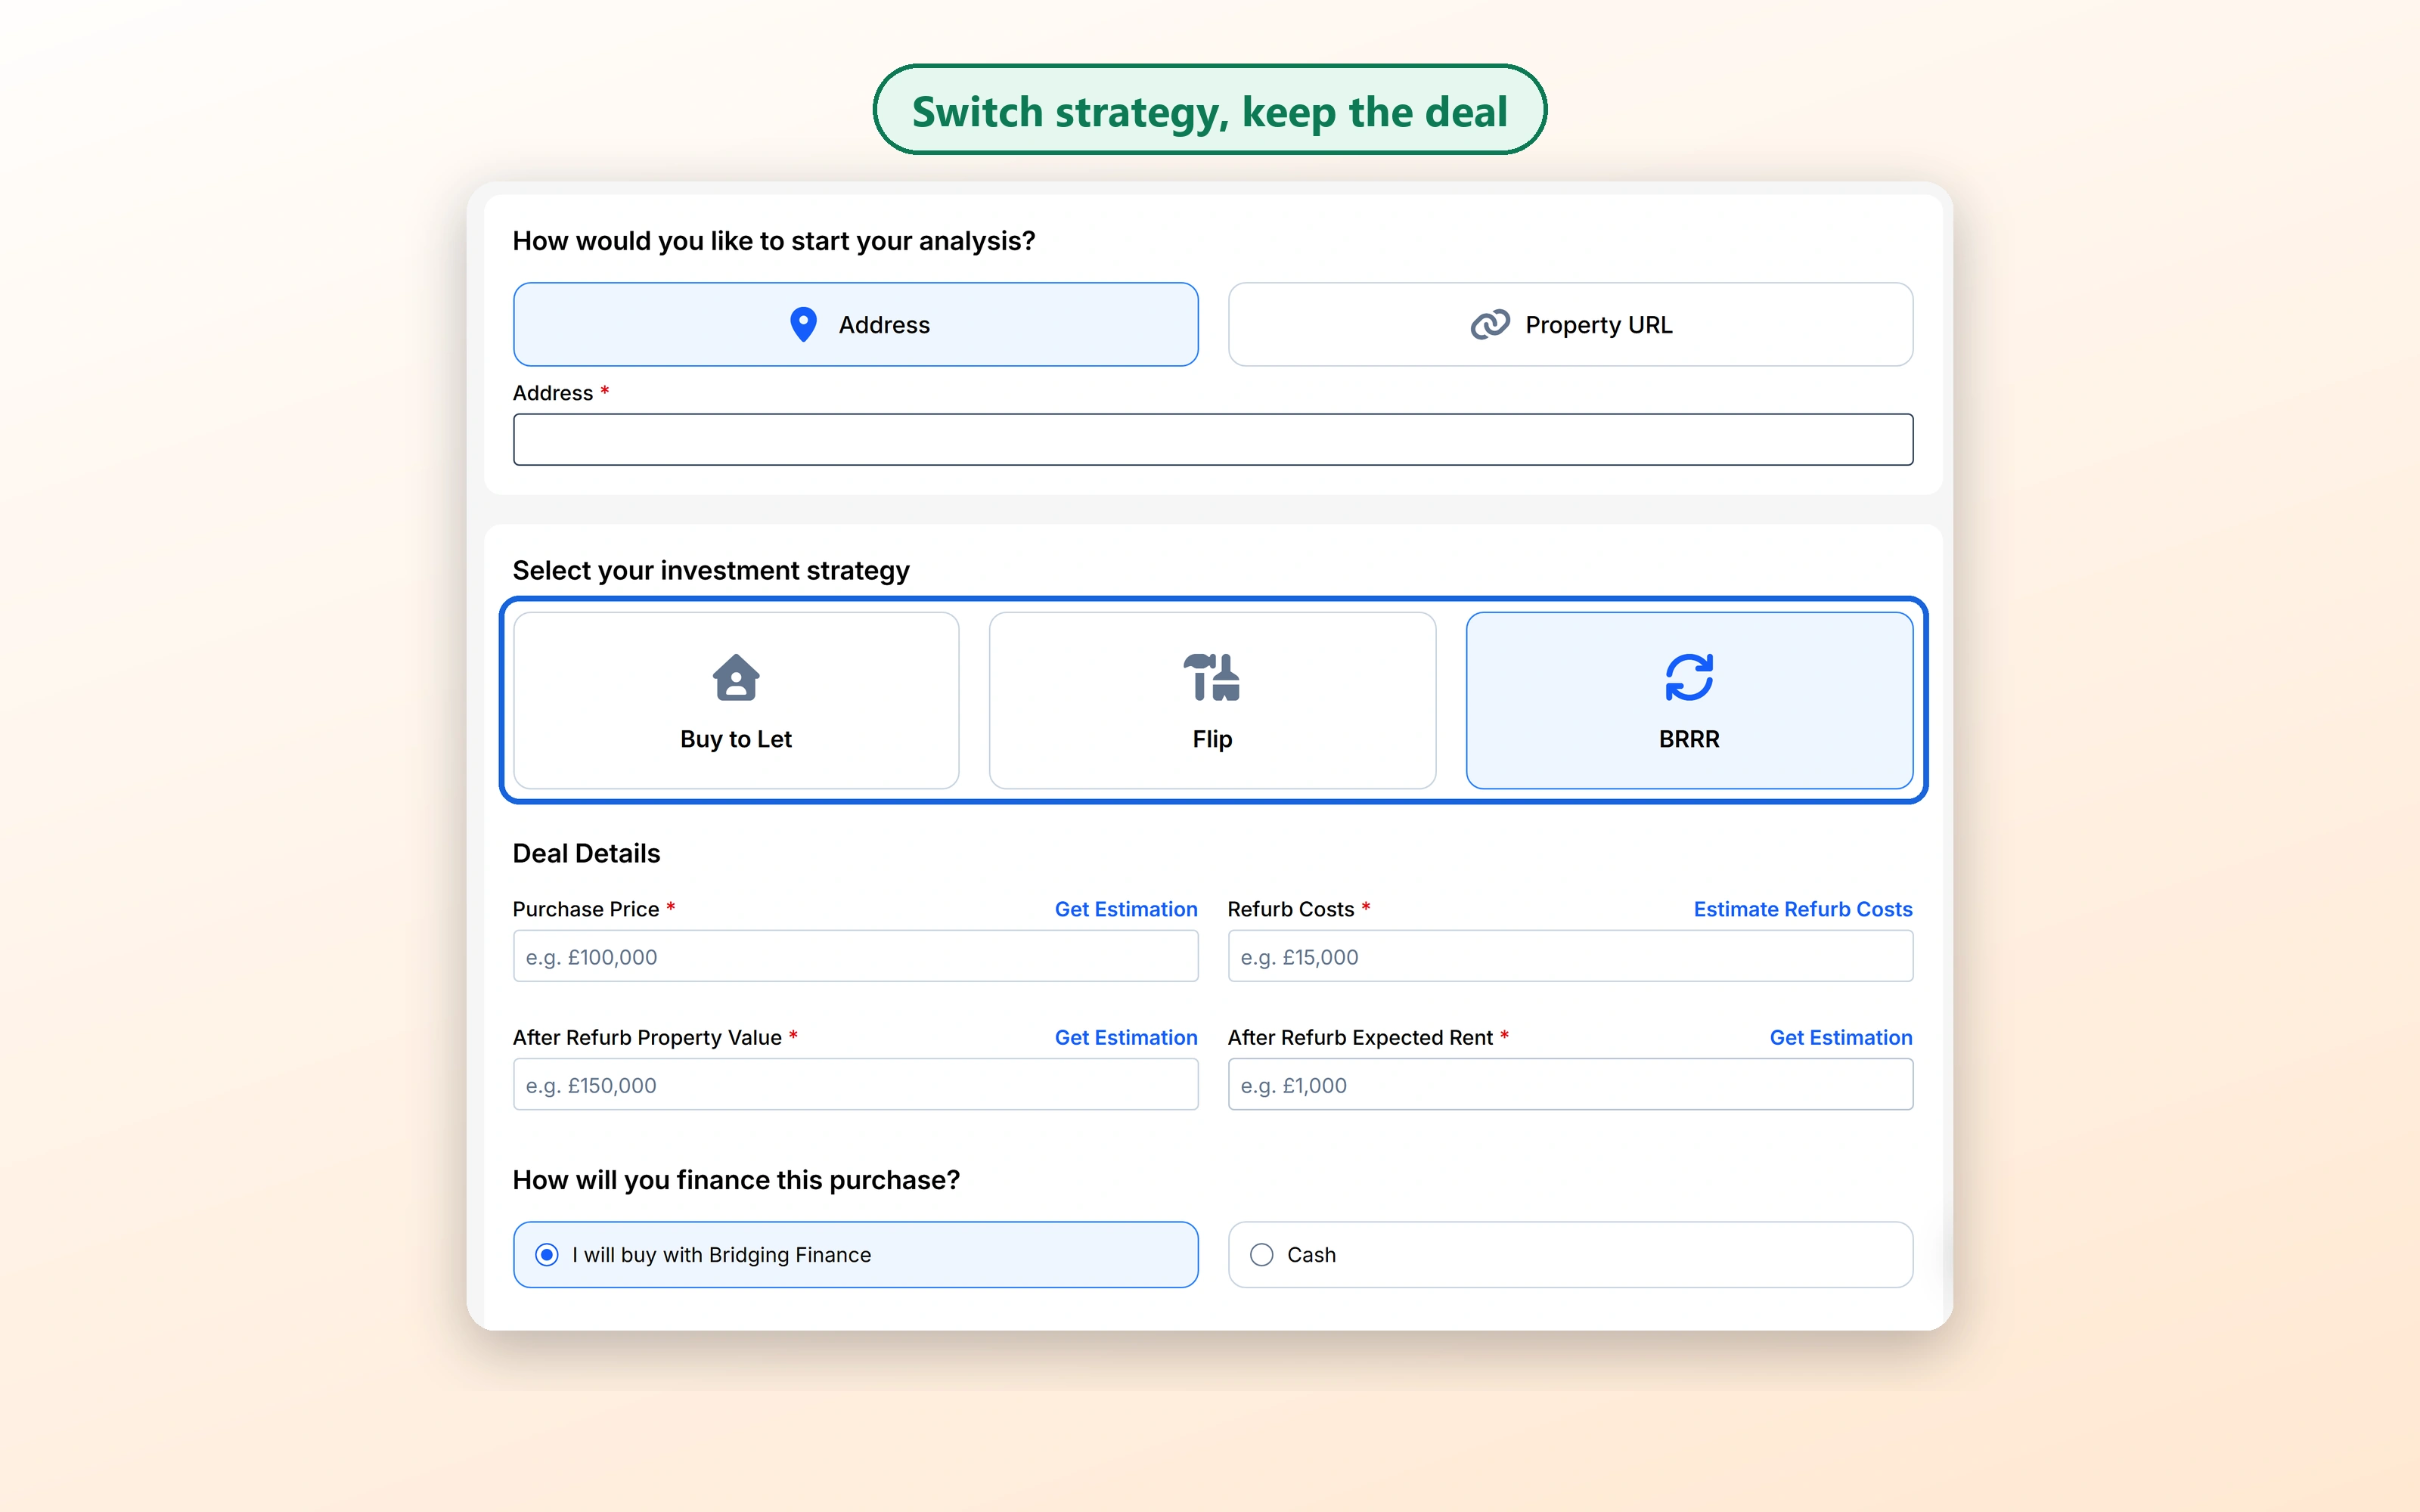
The three-tab deal analyser holds all three on one address.
Three tabs on one address
Before you pick a strategy
Four checks on the next purchase
The regional row is the context. The address is the decision.
- If most of the saved analyses in your region use the let tab, ask why this deal is different before you budget a refurb.
- For BRRR, get a written after-works valuation view and confirm the refinance lender's minimum ownership period with a broker.
- For a flip, price the sale from sold prices and include stamp duty and selling costs.
- Save all three tabs for the same address so you compare like with like.
Stamp duty on a residential purchase belongs in the flip sum. The price bands landlords set in their sourcing alerts are a different cut: what they ask the search to find, not which tab they save.
Where the city was recorded, let-tab analyses in Leeds show a median purchase of £130,000 and rent of £973. Liverpool shows £120,000 and £950. Both rest on few analyses next to the regional row.
Saved analyses are prospects, not purchases. Two saves of the same address count twice. The strategy is the tab that was saved. BRRR rent is usually the rent after works.
Figures are from Lendlord accounts approved for disclosure, not a picture of the whole market. Cells are kept where at least 10 analyses sit behind them. A London city row is left out because it does not match the Greater London mix. The largest portfolio band is left out of this note.
Compare the three tabs before the viewing
The regional mix tells you what gets modelled. Your works budget decides which tab survives.
Open the analyser
Expert insight from Aviram Shahar, Co-Founder and CEO of Lendlord. PropTech entrepreneur and property investor. Last updated November 2026. Run the same address through each strategy. The refurb is where the BRRR numbers break.
Official data sources
- GOV.UK, Stamp Duty Land Tax residential rates
- GOV.UK, tax when you sell a property
- UK House Price Index reports
- Bank of England Bank Rate
Links only. No tax rate or house-price figure from these pages is used above.