London vs North East Rental Stock 2026: Where Supply Is Falling and Yields Still Work
Published · Updated · 6 min read

Ask two landlords about the market and you will hear two different stories. In fact, that gap is the whole point of studying regional rental yields UK rather than a single national average. Right now, london vs north east rental stock trends tell a striking tale of diverging supply, demand, and returns.
Below, we unpack where rental stock is shrinking fastest, how the capital compares with the North East, and how to turn regional data into a buying decision. Meanwhile, we keep the focus on UK-wide patterns you can act on.
Key facts at a glance
- London: high values, compressed yields, cooling demand
- North East: lower entry, stronger yield percentages
- Trend: regional rental stock decline in many areas
- Tool: compare yields before you commit capital
Quick watch: the London and North gap
London vs North East rental stock trends
First, the divergence. London carries high capital values, so yields struggle to cover finance costs unless you bought years ago. By contrast, the North East offers lower entry prices and stronger yield percentages, which draws investors priced out of the capital.
However, the label alone is not enough. Specifically, one northern town may oversupply student housing while another sees rising demand and falling stock. Therefore, always drop down to the postcode, not the region.
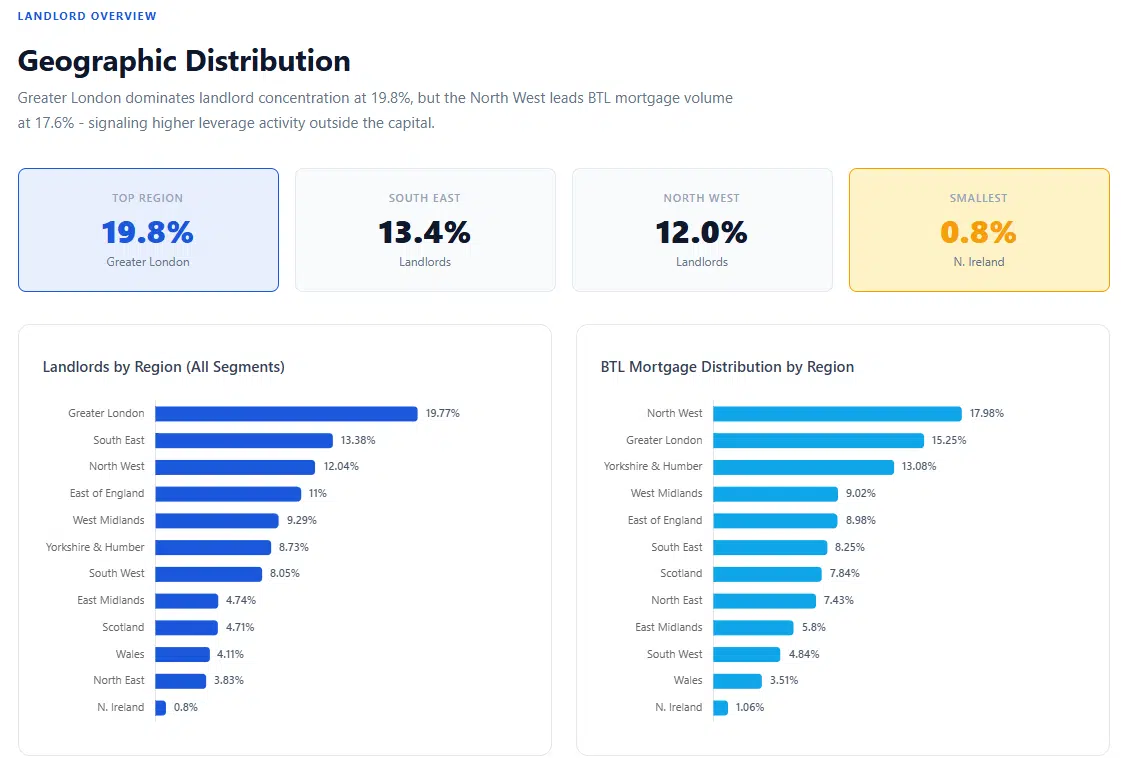
Where regional rental stock is falling fastest
Meanwhile, supply is tightening in many areas. As small landlords exit and compliance costs rise, available rentals fall while tenant enquiries climb. Consequently, rents hold firm, but sourcing a good deal gets harder.
Notably, this regional rental stock decline uk is uneven. In some cities, stock drops sharply. Elsewhere, build-to-rent adds new units. As a result, you need current, local data rather than last year's assumptions.
Compare deals
Benchmark regional yields side by side

When you analyse a prospect, the Deal Analyser lets you compare gross and net yield with local rent and cost data. As a result, you judge a northern deal against a southern one on true returns, not on the headline price alone.
Analyse a regional dealReading postcode data before you buy
Next, get granular. Regional averages hide the street-level detail that decides whether a deal works. For instance, capital growth, asking prices, and area facts vary hugely within a single city.
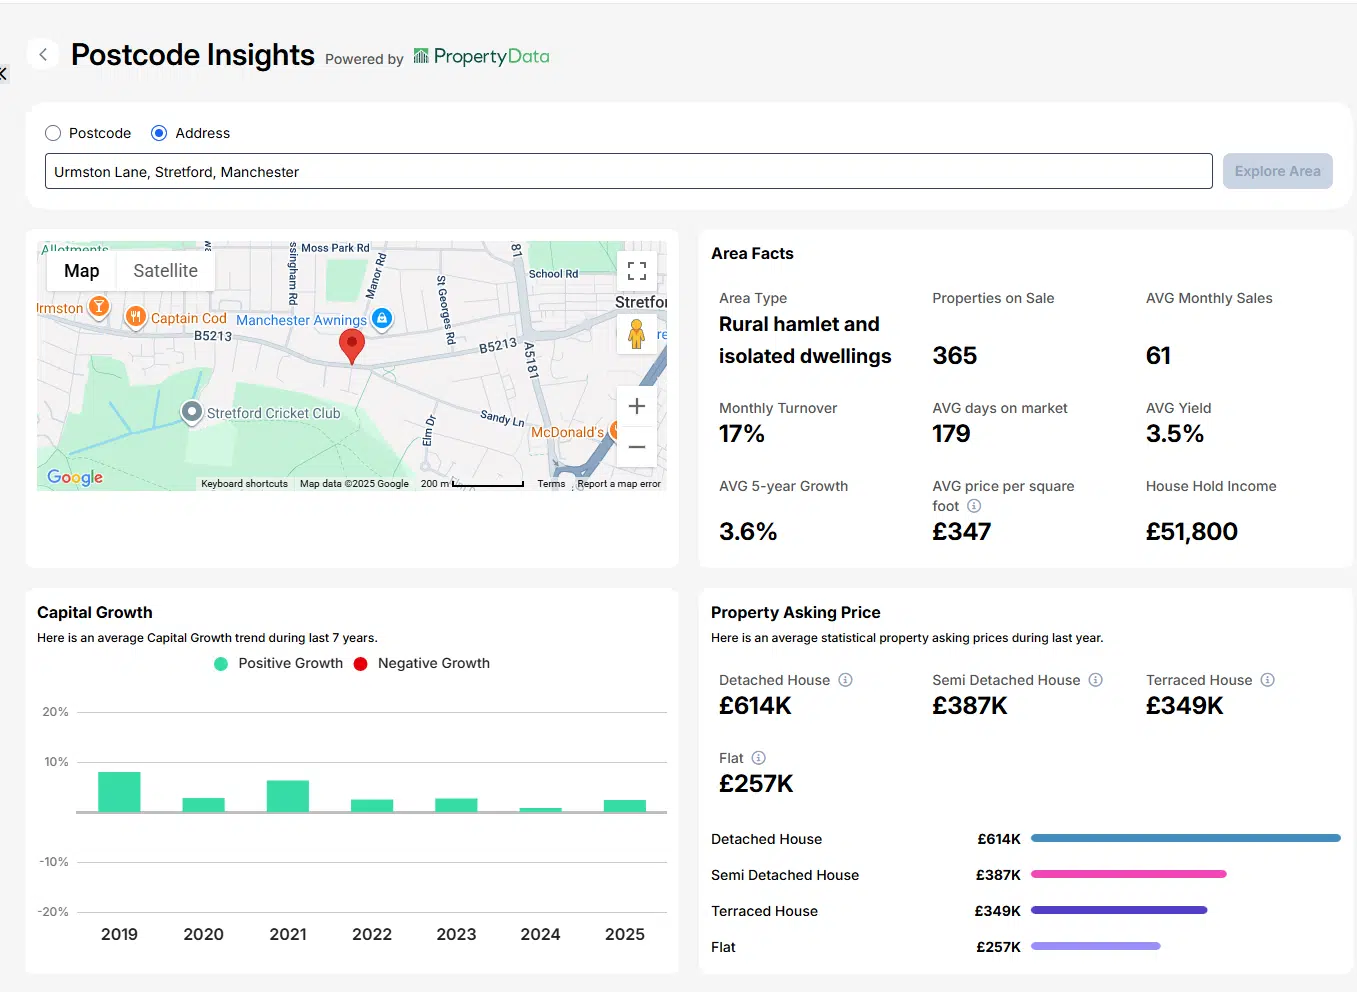
Local data
Check the street, not just the region
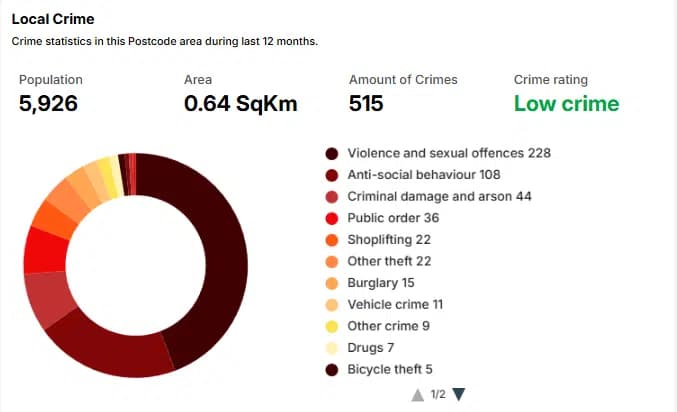
You can pull crime, schools, rent growth, and sold prices for the exact postcode before you offer. In practice, this stops you buying into a declining micro-market because the regional headline looked attractive.
Explore Postcode InsightsComparing yields across regions with a calculator
For a wider view, our regional rental yield calculator lets you compare cities side by side. Consequently, you see where gross and net returns actually beat the capital, and by how much.
Similarly, if you invest outside your home patch, trusted sourcers help. Our directory of top UK property sourcers by area lists specialists in northern and Midlands hotspots, so you are not relying on portals alone.
Watch: the future of buy-to-let by region
What is driving the divergence?
So why the widening gap? First, affordability sits at the heart of it. Because London prices reached levels that yields cannot easily service, investor demand cooled in the capital. Meanwhile, northern towns offer entry prices that still leave room for cash flow.
In addition, changing work patterns shifted tenant demand toward regional cities with strong employment. As a result, some northern and Midlands locations now see rising demand against falling supply, which supports rents.
The role of rising costs for landlords
Furthermore, compliance and finance costs weigh more heavily on thin-margin London stock. Consequently, landlords with slim yields in the capital feel the squeeze first. By contrast, higher-yielding northern units absorb cost increases with more headroom.
Still, the picture is nuanced. Prime central London behaves differently from outer boroughs, just as prosperous northern suburbs differ from struggling ones. Therefore, treat every claim about a region with healthy scepticism until the postcode data backs it up.
Commuter belt and value hotspots
Meanwhile, do not overlook the towns between the extremes. Some investors target commuter locations within an hour of a major city, where yields beat the capital but demand stays strong. For example, well-connected towns often blend reasonable prices with reliable tenant interest.
However, a commuter label alone guarantees nothing. Specifically, a station and a supermarket do not create demand on their own. So run each town through the calculator rather than assuming proximity equals performance.
Balancing risk across regions
Additionally, spreading capital reduces single-market risk. Holding everything in one city that later oversupplies concentrates your exposure. By contrast, two or three proven postcodes give you options when local conditions shift.
In practice, rebalancing matters too. When regional data moves, review whether a market you liked still earns its place. Ultimately, discipline beats loyalty when the numbers change.
Building a regional strategy that lasts
- Pick two or three target regions based on yield and your capacity to manage.
- Benchmark every deal against local median rent and void rates.
- Stress test at higher rates even when finance has softened.
- Verify supply trends with current data, not just sold prices.
- Line up finance early so you move when the right unit appears.
Finally, revisit your assumptions every six months. Because yields that worked in 2024 can compress after a wave of sales floods a postcode, staying nimble beats loyalty to a town you liked last year.
How to spot a turning market early
Meanwhile, timing helps. Encouragingly, a few signals flag a shifting market before the headlines catch up. First, watch days on market and the rate of price reductions. Next, track the balance between new listings and tenant enquiries in your target postcodes.
Additionally, agent instructions tell a story. When landlord instructions fall while demand holds, supply is tightening, which supports rents. As a result, spotting that pattern early lets you buy before competition returns to a recovering area.
Similarly, keep an eye on new build-to-rent pipelines nearby. Because a large new scheme can add supply quickly, it may soften rents in one pocket even as the wider town tightens. Therefore, check planning portals as well as portal listings before you commit. In addition, speak to two or three local agents, since their on-the-ground view often confirms or challenges the data before you offer.
Wales, Scotland, and Northern Ireland note
Additionally, devolved rules differ across the UK nations. Scotland uses different tenancy structures, and Wales has its own renting reforms. Therefore, verify local regulation before applying UK-wide yield data to a specific purchase.
In short, the average UK yield tells you almost nothing useful. The investors winning in 2026 know their chosen postcodes cold, and they let the data, not the headline, make the call.
Official data sources
Regional trends here are supported by official UK statistics. For the primary data, check these sources.
Compare regional yields, benchmark against local data, and stress-test deals before you buy in a new region.
Compare regional deals with Deal AnalyserFrequently asked questions
How do London and North East rental yields compare in 2026?
In short, London carries high values and compressed yields, while the North East offers lower entry prices and stronger yield percentages. However, void and management costs vary by town, so always check the postcode.
Is rental stock really declining across the UK?
Yes, though unevenly. As small landlords exit and compliance costs rise, available rentals fall in many areas while enquiries climb. Consequently, rents hold firm but sourcing gets harder.
How can I compare rental yields by region?
Specifically, use a regional rental yield calculator alongside a deal analyser with postcode data. As a result, you compare gross and net returns across cities on equal terms rather than by headline price.
Do the same rules apply across the UK?
However, devolved nations differ. Scotland uses different tenancy structures, and Wales has its own reforms. Therefore, verify local regulation before applying UK-wide yield data to a purchase.