Small Landlords Buy in the South East. The 20+ Crowd Buys in the North West
Published
4 min read

The South East holds 14.5% of landlords with 1 to 3 properties and only 5.4% of those with 20 or more. The North West runs the other way: 9.8% of the smallest segment, 19.6% of the largest.
That is a 19-point swing between the two regions as portfolios grow. Small landlords sit in the commuter belt. Large ones are concentrated in the north west of the country, and the gap is wide enough to change how you read any national average.
Lendlord's Q3 2026 Market Report shows landlord location one portfolio segment at a time. Stack the four segments side by side and the picture below emerges.
Read from the Q3 2026 Lendlord BTL Market Report, landlord location by segment. Each column is a share of landlords in that segment, so every column totals 100%.
Buying where you live, or where the strategy works
The regional mix by portfolio size
Twelve regions, four segments. Read down a column to see where that size of landlord holds property, and across a row to see how one region's pull changes with scale.
| Region | 1-3 | 4-10 | 11-20 | 20+ |
|---|---|---|---|---|
| Greater London | 22.1% | 20.5% | 15.0% | 23.2% |
| South East | 14.5% | 14.6% | 9.2% | 5.4% |
| North West | 9.8% | 11.7% | 11.8% | 19.6% |
| East of England | 11.3% | 9.3% | 11.8% | 12.5% |
| West Midlands | 9.1% | 9.0% | 9.2% | 8.9% |
| Yorkshire and Humberside | 10.2% | 6.7% | 11.8% | 7.1% |
| South West | 7.8% | 6.4% | 7.8% | 5.4% |
| East Midlands | 3.8% | 4.1% | 5.9% | 5.4% |
| Scotland | 2.9% | 7.0% | 5.9% | 8.9% |
| Wales | 3.6% | 5.6% | 2.6% | 0.0% |
| North East | 4.4% | 3.8% | 8.5% | 3.6% |
| Northern Ireland | 0.5% | 1.4% | 0.7% | 0.0% |
Source: Lendlord BTL Market Report, Q3 2026, landlord location filtered by portfolio segment.
Greater London tops every column, which is what you would expect from the largest market in the country. What it does in between is more interesting. London's share dips to 15.0% in the 11 to 20 band before recovering to 23.2% at 20 or more. Mid-sized portfolios are the ones most likely to be built somewhere else.
Before you buy outside your patch
Check the numbers on a region you do not know
Moving into an unfamiliar area means you lose the local instinct you rely on at home. Run the property through a deal model first and let the rent, the yield and the finance cost carry the argument.
Analyse a dealWhere the biggest shifts happen
Four regions move enough between the smallest and largest segments to matter when you plan a purchase.
| Region | 1-3 | 20+ | Change |
|---|---|---|---|
| South East | 14.5% | 5.4% | -9.1 pts |
| North West | 9.8% | 19.6% | +9.9 pts |
| Scotland | 2.9% | 8.9% | +6.0 pts |
| Yorkshire and Humberside | 10.2% | 7.1% | -3.1 pts |
Source: Lendlord BTL Market Report, Q3 2026. Change is measured in percentage points between the two segments.
The South East fall is the cleanest signal in the dataset. It is a region people buy into when they are buying near home, and buy out of when the portfolio has to pay for itself. Scotland moving from 2.9% to 8.9% says something similar in reverse.
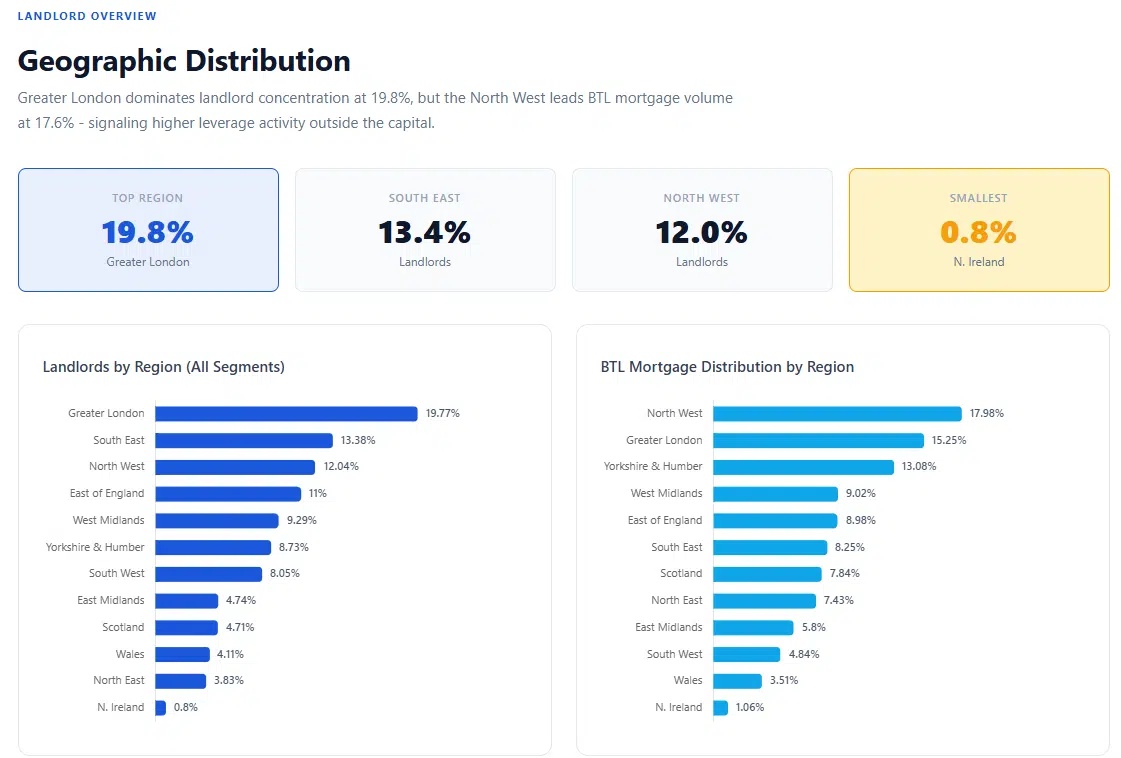
Two regions drop out of the top segment entirely
Wales and Northern Ireland both register landlords in the three smaller segments and neither appears in the 20 or more band at all. Wales runs at 3.6% of small landlords and 5.6% of the 4 to 10 group, then falls to 2.6% at 11 to 20 and disappears.
Treat that as a thin-data warning rather than a verdict on either market. The 20 or more segment is the smallest group in the report, so a region with a modest landlord base can record zero without anything being wrong. It does tell you that scaling a portfolio in those two markets is uncommon among landlords using the platform.
The North East behaves differently again. It peaks at 8.5% in the 11 to 20 band, well above its 3.9% national share, then falls back to 3.6%. Mid-sized portfolios find it; the largest ones concentrate elsewhere.
What to do with this before your next purchase
The distribution is a map of where other landlords ended up, not a recommendation. Use it to pressure-test your own plan.
- Name the segment you are building towards. A 4 to 10 portfolio and a 20-plus portfolio point at different regions in this data, so pick the target before the property.
- If you are buying in the South East beyond your third property, write down why. The segment data says most landlords stop adding there.
- Check the finance picture as well as the price. Company ownership and rates vary by region, covered in the buy-to-let ownership and rates research.
- Pair the location call with a yield check. Town-level numbers are broken down in the Midlands yields analysis.
- Model the individual deal before the region convinces you. The portfolio benchmarks post shows how thin net returns get in the lower band.
Figures come from the landlord location chart in Lendlord's Q3 2026 BTL Market Report, read once per portfolio segment filter. Each segment is reported as a share of landlords within that segment, so the four columns are independent distributions and each totals 100%.
This is platform data covering landlords connected to Lendlord, not a census of the UK private rented sector. Segments with a small base, particularly 20 or more properties, move more on small changes than the larger segments do.
Track the portfolio you are actually building
Keep properties, finance and returns in one place as the portfolio grows across regions.
Set up your portfolio
Expert insight from Aviram Shahar, Co-Founder and CEO of Lendlord · PropTech entrepreneur and property investor · Last updated September 2026
The way I read this: the first three properties are usually bought with local knowledge, and everything after that is bought with a spreadsheet. That is why the South East thins out and the North West fills up. Neither region is right or wrong. The question is whether your next purchase is being chosen by the numbers or by the drive time.